Both employment and unemployment rates have improved in Hamilton and are better than the provincial average, but with growing numbers of young adults moving to Hamilton, youth unemployment has remained at recession levels of 15%. While the number of people on social assistance has fallen more quickly than any city in Ontario since the recession, Hamilton still remains above the provincial average. Poverty rates, similarly, have shown no improvement since 2001.
The unemployment rate is often cited as the primary indicator of Hamilton’s increasing prosperity. Monthly unemployment data often shows the Hamilton CMA to be among the communities with the lowest unemployment rates in Ontario and, in some months, Canada as a whole. But the Hamilton CMA includes the municipalities of Burlington and Grimsby, and these two cities have much lower poverty and unemployment rates than Hamilton, partly due to the higher price of housing in those communities, so people with lower incomes just can’t afford to live in Burlington or Grimsby. To better understand the reality in Hamilton, municipal level data is more useful than CMA data.
Annual unemployment data is available for the City of Hamilton, and does confirm that Hamilton’s unemployment rate is improving compared to the average for Ontario. Chart 1 shows that the city of Hamilton’s unemployment rate has declined to 6.2% in 2014, from a high of 9.3% in the last recession (2009). This almost exactly mirrors the decline in the Region of Waterloo. In contrast the City of Toronto’s unemployment rate has barely changed since the recession and was 9.5% in 2014. The average for Ontario sits between these two distinct trends, with Ontario’s unemployment rate at 7.3% in 2014.
The City of Hamilton’s unemployment rate in 2014 (6.2%) was still higher than the 1998-1999 period where it went as low as 5.4%. The rate for Hamilton’s neighbouring municipalities of Burlington and Grimsby continues to be lower than Hamilton (5.5% in 2014)[1].
Chart 1. Unemployment rate, City of Hamilton, and selected communities, 1987-2014
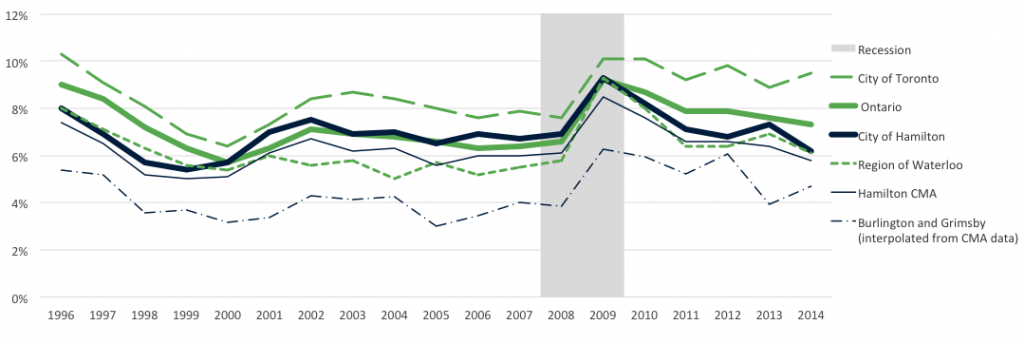
Data source: Statistics Canada, (CANSIM tables 109-5334, 109-5304 and 109-5004: Labour Force Survey 1996-2014)
The unemployment rate as an indicator is quite limited in what it explains about the labour market. To meet the Statistics Canada definition of unemployed, a person without a job has to be actively looking for work. Many others consider themselves unemployed, but have been discouraged from searching for work because their experience of the labour market has been so negative they don’t see how they could ever get a job. Others may consider themselves unemployed, but feel the only way to regain a foothold in the labour market is to postpone their job search and return to school to upgrade their skills.
Both of these groups would not be counted as unemployed, but as people “not participating in the labour force”. Other non-participants in the labour force include people without jobs who may be doing so by choice, such as retired people, or others raising their children full-time, so the participation rate is not an entirely suitable indicator of economic health either.
The employment rate is an indicator favoured by some economists, as it is simplest to understand: the percentage of a population (over age 15) who are working. But when some communities have large number of older residents, there is a lower employment rate because of the larger pool of retired workers. Limiting the employment rate to the 15-64 age group is called the “working age employment rate” and can be more helpful for comparing different communities.
Chart 2 shows the working age employment rate for the Hamilton CMA since 1987 compared to other communities. Since the 2008-9 recession, less than three quarters of 15-64 year olds in the Hamilton CMA have been working, which is a lower proportion than in the 1987-1990 and 2003-2005 periods. But when comparing to the average for Ontario and the Toronto CMA, the Hamilton CMA’s working age employment rate has performed better since the most recent recession. The working age employment rate in Kitchener-Cambridge-Waterloo CMA continues to substantially outperform the Hamilton CMA, as it has since at least 1987, with the exception of the height of the 2008-2009 recession.
Since 2011, however, the working age employment rate in the Hamilton CMA has dipped from about 74% to about 72% in 2014, the same as in the 2008-2009 recession period. A more detailed analysis shows that this recent drop is driven almost entirely by large declines in the employment rate of young women aged 15-24 and older men aged 55-64. The employment rate of young women has gone from 64% in 2011 to 53% in 2014 and for older men aged 55-64, their employment rate has slipped from 66% in 2011 to 60% in 2014. The reasons for these rapid declines in these groups are not clear, but could be due to a combination of factors including more young women staying in school or training, more young women and older men facing unemployment, more older men retiring early (due to choice or layoffs), or unstable data due to smaller sample sizes for these groups. The employment rates of these groups will need to be monitored to see if the trend continues and better understand the factors that are causing the decline in the employment rate of these groups.
Chart 2. Working age employment rate (age 15-64), Hamilton CMA and selected communities, 1987-2014
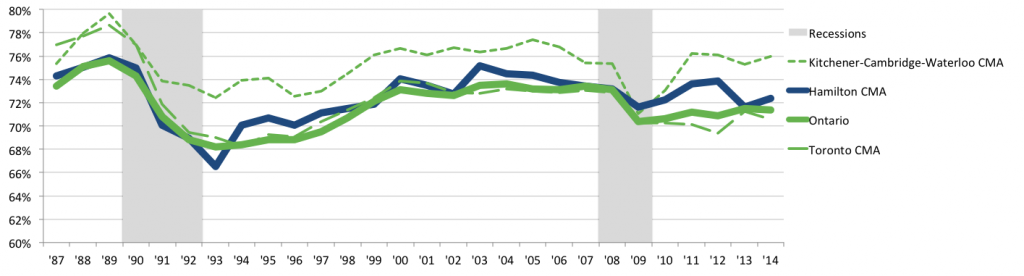
Data source: Statistics Canada, (CANSIM tables 282-0053 and 282-0129: Labour Force Survey 1987-2014)
Due to their relative lack of paid labour market experience, youth as a group always face a more challenging time obtaining paid employment. The gap between youth and overall unemployment rates is an important indicator of the disproportionate challenge faced by youth in different regions or time periods and the stress they experience in trying to gain a foothold in the labour market.
Annual data for youth unemployment rates (ages 15-24) is available at the municipal level, however it is best to examine the trends over longer periods than just year over year, because annual estimates can go up and down dramatically due to Statistics Canada’s Labour Force Survey’s small sample sizes.
Chart 3 shows that the youth unemployment rate has not recovered to pre-recession levels in any of the communities examined. The city of Hamilton has among the highest youth unemployment rates in the comparison communities. The city of Toronto is unique among the communities examined as the youth unemployment rate has continued to soar in the years after the recession, hitting 20% for the 2012-2014 period. This finding may give some pause to Hamilton youth who may be currently considering moving to Toronto for better job opportunities. For all communities, the youth unemployment rate is around double the general unemployment rate. The Region of Waterloo however has the smallest gap between the youth and general unemployment rate (6 percentage points).
Chart 3. Youth unemployment rate (age 15-24), City of Hamilton, Hamilton CMA, City of Toronto, Region of Waterloo Ontario and Canada, 2006-2014
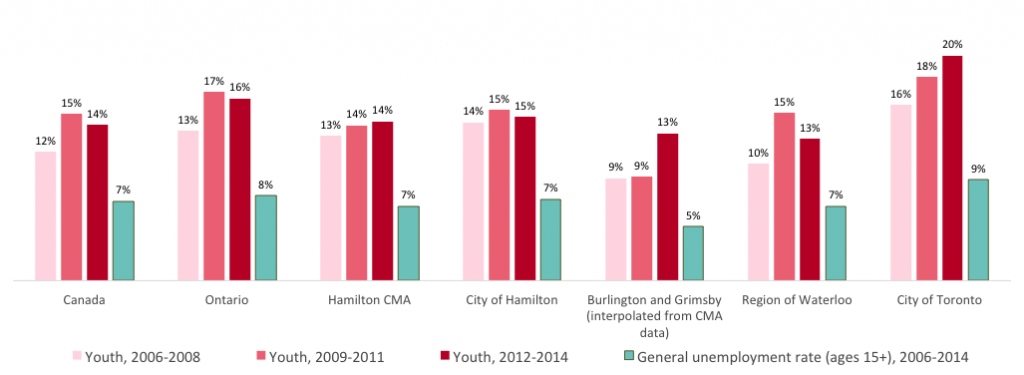
Data source: Statistics Canada, (CANSIM tables 109-5334 and 109-5304: Labour Force Survey 2006-2014)
An analysis of employment rates by age groups shows that employment of Hamilton youth is dropping (chart 4). The youth employment rate (aged 15-24) has decreased substantially since 1987, from a high of 70% to 53% in 2014.
The reduction is not likely to be explained by the higher rates of post-secondary education among youth in the last decades, since any employment even part-time, or summer jobs would be included in these figures. The data may be more likely to reflect the increasing difficulty for students to find summer jobs as compared to previous decades. Hamilton’s de-industrialization is another important factor, as the 1990s recession reduced the number of youth employed in manufacturing, and there has been very little hiring of youth in that sector since that time.
The decreasing employment rate of youth is not unique to Hamilton, this is a similar trend observed across Ontario. In Hamilton, however, this trend has extra urgency as the city’s growth of young people is rising much faster than in other communities.
Chart 4. Employment rates by age group, Hamilton CMA, 1987-2014
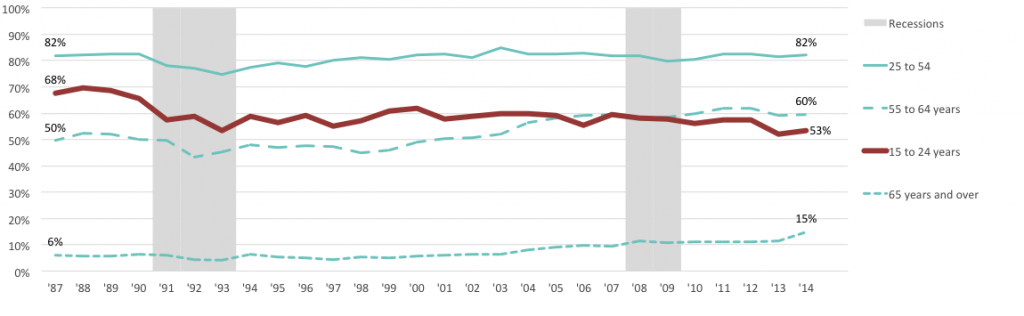
Data source: Statistics Canada, (CANSIM tables 282-0053 and 282-0129: Labour Force Survey 1987-2014)
Hamilton’s quality of life, historical character, growing culture and entertainment sector, access to nature, lower housing prices than Toronto and growing emphasis on sustainable transportation like cycling and LRT is clearly attracting many Millennials to stay here or move from other communities.
Chart 5 shows that Hamilton’s youth growth rate (aged 20-29) was 2.0% in 2013-14, more than double the average for the general population (0.9%). In 2012, Hamilton’s growth of the young adult age group hit 3.1%, the highest since at least 1987. Some of this growth can be attributed to general demographic shifts with the large Millennial generation entering adulthood, however, Hamilton’s growth rate has been higher than the average for Ontario (1.6% growth in the provincial young adult population in 2013-14).
In contrast, the growth rate for young adults has declined in both Toronto and Waterloo since 2005-6. The differences between Waterloo and Hamilton are most stark, with the city of Hamilton having a larger population of young adults aged 20-29 than the region of Waterloo, for the first time since 2001. Hamilton’s population of young adults reached 81,250 in 2014, a rise of over 6,800 persons compared to 2010.
The rise of youth employment networks in Hamilton, such as HIVE, is another sign that young adults are a major driving force of Hamilton’s ‘renaissance’. But if Hamilton’s economy does not welcome this growing youth population into the labour market, the growth may be reversed and Hamilton’s reputation for renaissance could be short-lived.
Chart 5. Growth rate of young adults (aged 20-29), compared to general population growth, City of Hamilton and selected communities, (2005-6 to 2013-14)
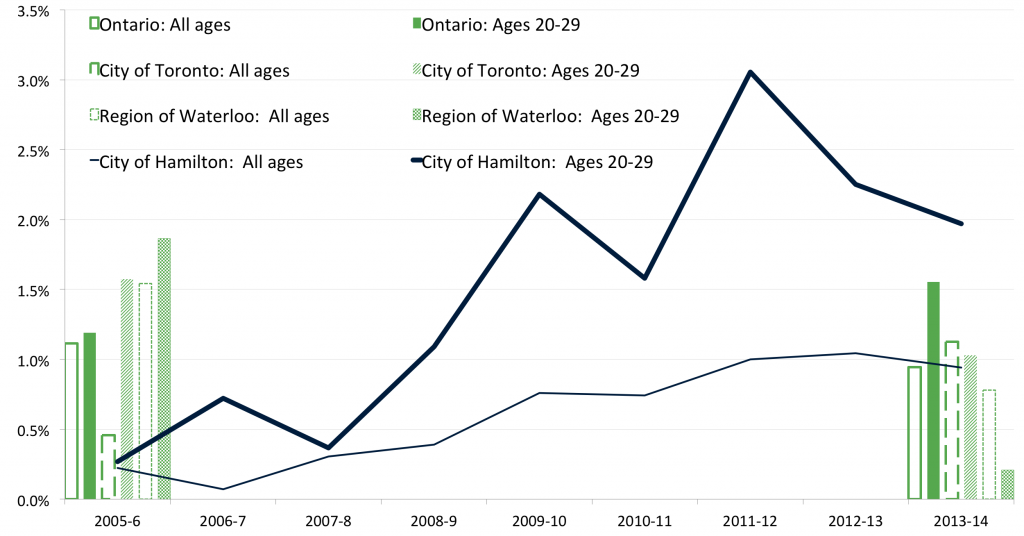
Data source: Statistics Canada, (CANSIM Table 051-0062: Estimates of population 1987-2014)
The City of Hamilton’s overall poverty rate has not improved in the 2001-2013 period, similar to the trend for Toronto and Waterloo (chart 6). Hamilton’s poverty rate was approximately 19% in 2001, in between the rate for Waterloo (15%) and Toronto (27%).
The median income (adjusted for inflation) of persons with low incomes has improved in all three communities examined. The introduction of the Ontario Child Benefit in 2008 corresponds with an increase in the median income for low-income residents, reversing Hamilton’s decline in median incomes in this group from 2001-2005. The OCB now increases the income of very low-income parents by over $1,300 per child and is especially useful for parents leaving social assistance for a low-wage job as they can keep this benefit as they transition into the paid labour market. The median income of persons in low income in these three communities remains, however, less than three-quarters of the poverty line, as defined by Statistics Canada’s before tax Low Income Measure.
Chart 6. Percentage of persons with a family income below the before tax Low Income Measure (LIM) and median income of low-income residents (adjusted for inflation in 2013 dollars), City of Hamilton, City of Toronto and Region of Waterloo, 2001-2013
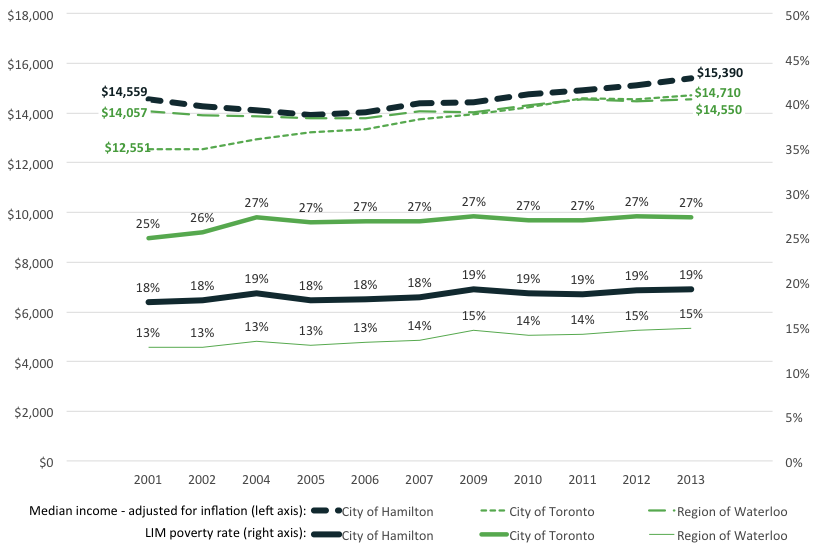
Data source: Statistics Canada, T1 Family Tax Filer data (2001-2014)
Data note: Tax filer data has important limitations when used to analyse poverty rates. Tax files only have limited family information concerning couples, parents and dependents living in the same household, and the data does not have information about extended families living in the same household and financially supporting each other. Therefore, taxfiler data can over-estimate the poverty rate, especially in communities where there is a higher rate of extended families living in a household. Due to the elimination of the mandatory long-form census, taxfiler data is used as a replacement, but the data quality is not as high.
Those who experience a sustained period of unemployment, and drain almost all their savings, become eligible for Ontario Works, the provincial safety net meant to provide “employment assistance and financial assistance”.
The financial assistance part of Ontario Works is currently inadequate to live a safe and minimally decent life in Hamilton. As chart 7 illustrates, financial support from OW does not cover the cost of nutritious food and a bachelor apartment, and for a single person, only reaches 43% of the poverty line.
The inadequacy of social assistance means that many recipients are forced into unsafe housing situations and sacrifice their health through cuts to their intake of healthy food.
Chart 7. Monthly social assistance rates for a single person on Ontario Works compared to food and housing in Hamilton’s and the poverty line, 2014
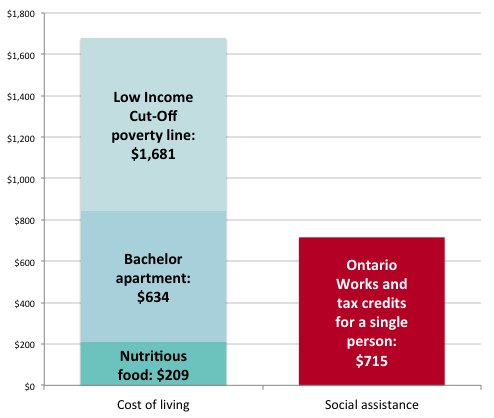
Data source: Statistics Canada (Low Income Lines, 2013-2014), Canada Housing and Mortgage Corporation (Rental Market Report, 2015), City of Hamilton (How much does healthy eating cost in 2014?), Income Security Advocacy Centre (Current Social Assistance Rates, 2014).
Hamilton experienced an increase in the number of Ontario Works recipients after the 2008-9 recession, similar to most large cities in Ontario. Low-wage workers are often lower skilled or have less experience, so are the first to be laid off during an economic downturn. This leads to a rise in the number of people who need social assistance to survive. Hamilton’s recovery in OW caseloads, however, has been the fastest in Ontario, and Hamilton’s percentage of households receiving Ontario Works was 5.8% in 2014, only about half a percentage point higher than the rate in 2005 (chart 8). The deep poverty experienced by those living on social assistance is a major barrier to transitioning back to employment, and is discussed in further detail on page 38 in section 5 of this report.
Chart 8. Percentage of households receiving Ontario Works,
City of Hamilton and selected communities, 2005-2013
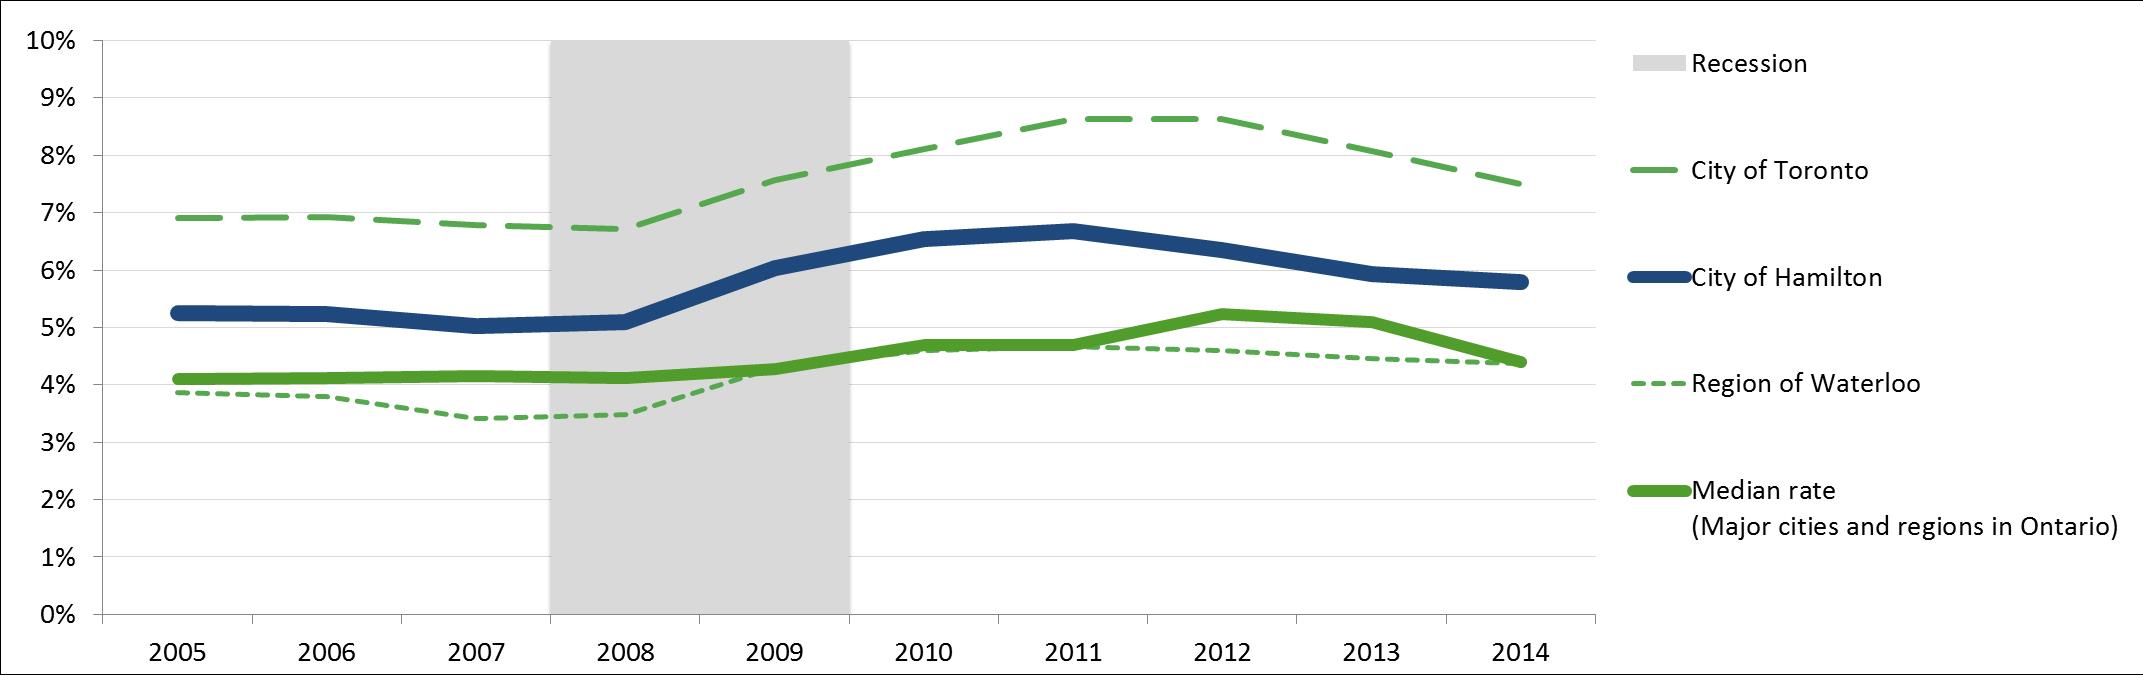
Data source: Ontario Municipal Benchmarking Institute. (Performance Measurement Reports 2006, 2009, 2012 and 2014).
More detailed Hamilton OW data about caseloads and outcomes show that while there is a slight improvement in employment income for the quarter of recipients who leave social assistance due to employment, the income from these jobs was only on average $1,521 a month in 2012, still well below the poverty line. The average time on social assistance has increased after the recession, and was about 15 months in 2012. The research evidence indicates that reductions in OW caseloads are mainly due to people finding jobs on their own, as caseworkers juggle significantly high caseloads and significant administrative duties, which severely limits time for client support and employment assistance[2].
Chart 9. Selected performance measures for Ontario Works (all monthly averages), City of Hamilton, 2006, 2009 and 2012
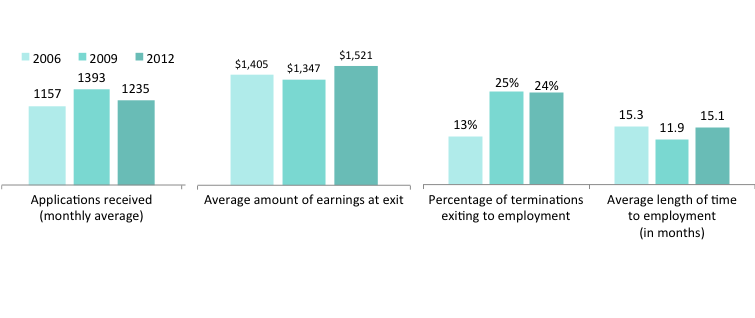
Data source: City of Hamilton. (Ontario Works Service Plan, various years)
____________________________________________________________________________________
[1] The rates for the combined Burlington and Grimsby part of the Hamilton CMA were calculated by interpolating from Hamilton CMA and city of Hamilton data.
[2] Pennisi, S. (2013). Everybody needs to be doing something: Exploring the contradictions in Ontario Works and the normative expectations behind the work of becoming eligible, employable and employed. PhD dissertation for School of Social Work, McMaster University. https://macsphere.mcmaster.ca/handle/11375/13944
Donations to the Foundation are invested for the long term in public markets and in alternative investments. Investment income is then allocated annually to support granting, community leadership and operations. The summary and charts presented here provide both a financial snapshot and a history of recent activity that underlies the grants and community leadership activities represented in this annual report, made possible by remarkable donors.
Donations to the Foundation are from individuals, corporations and other charities. Donors may contribute to named endowment or flowthrough funds, to the Board-directed Community Fund, or to HCF’s community leadership projects.
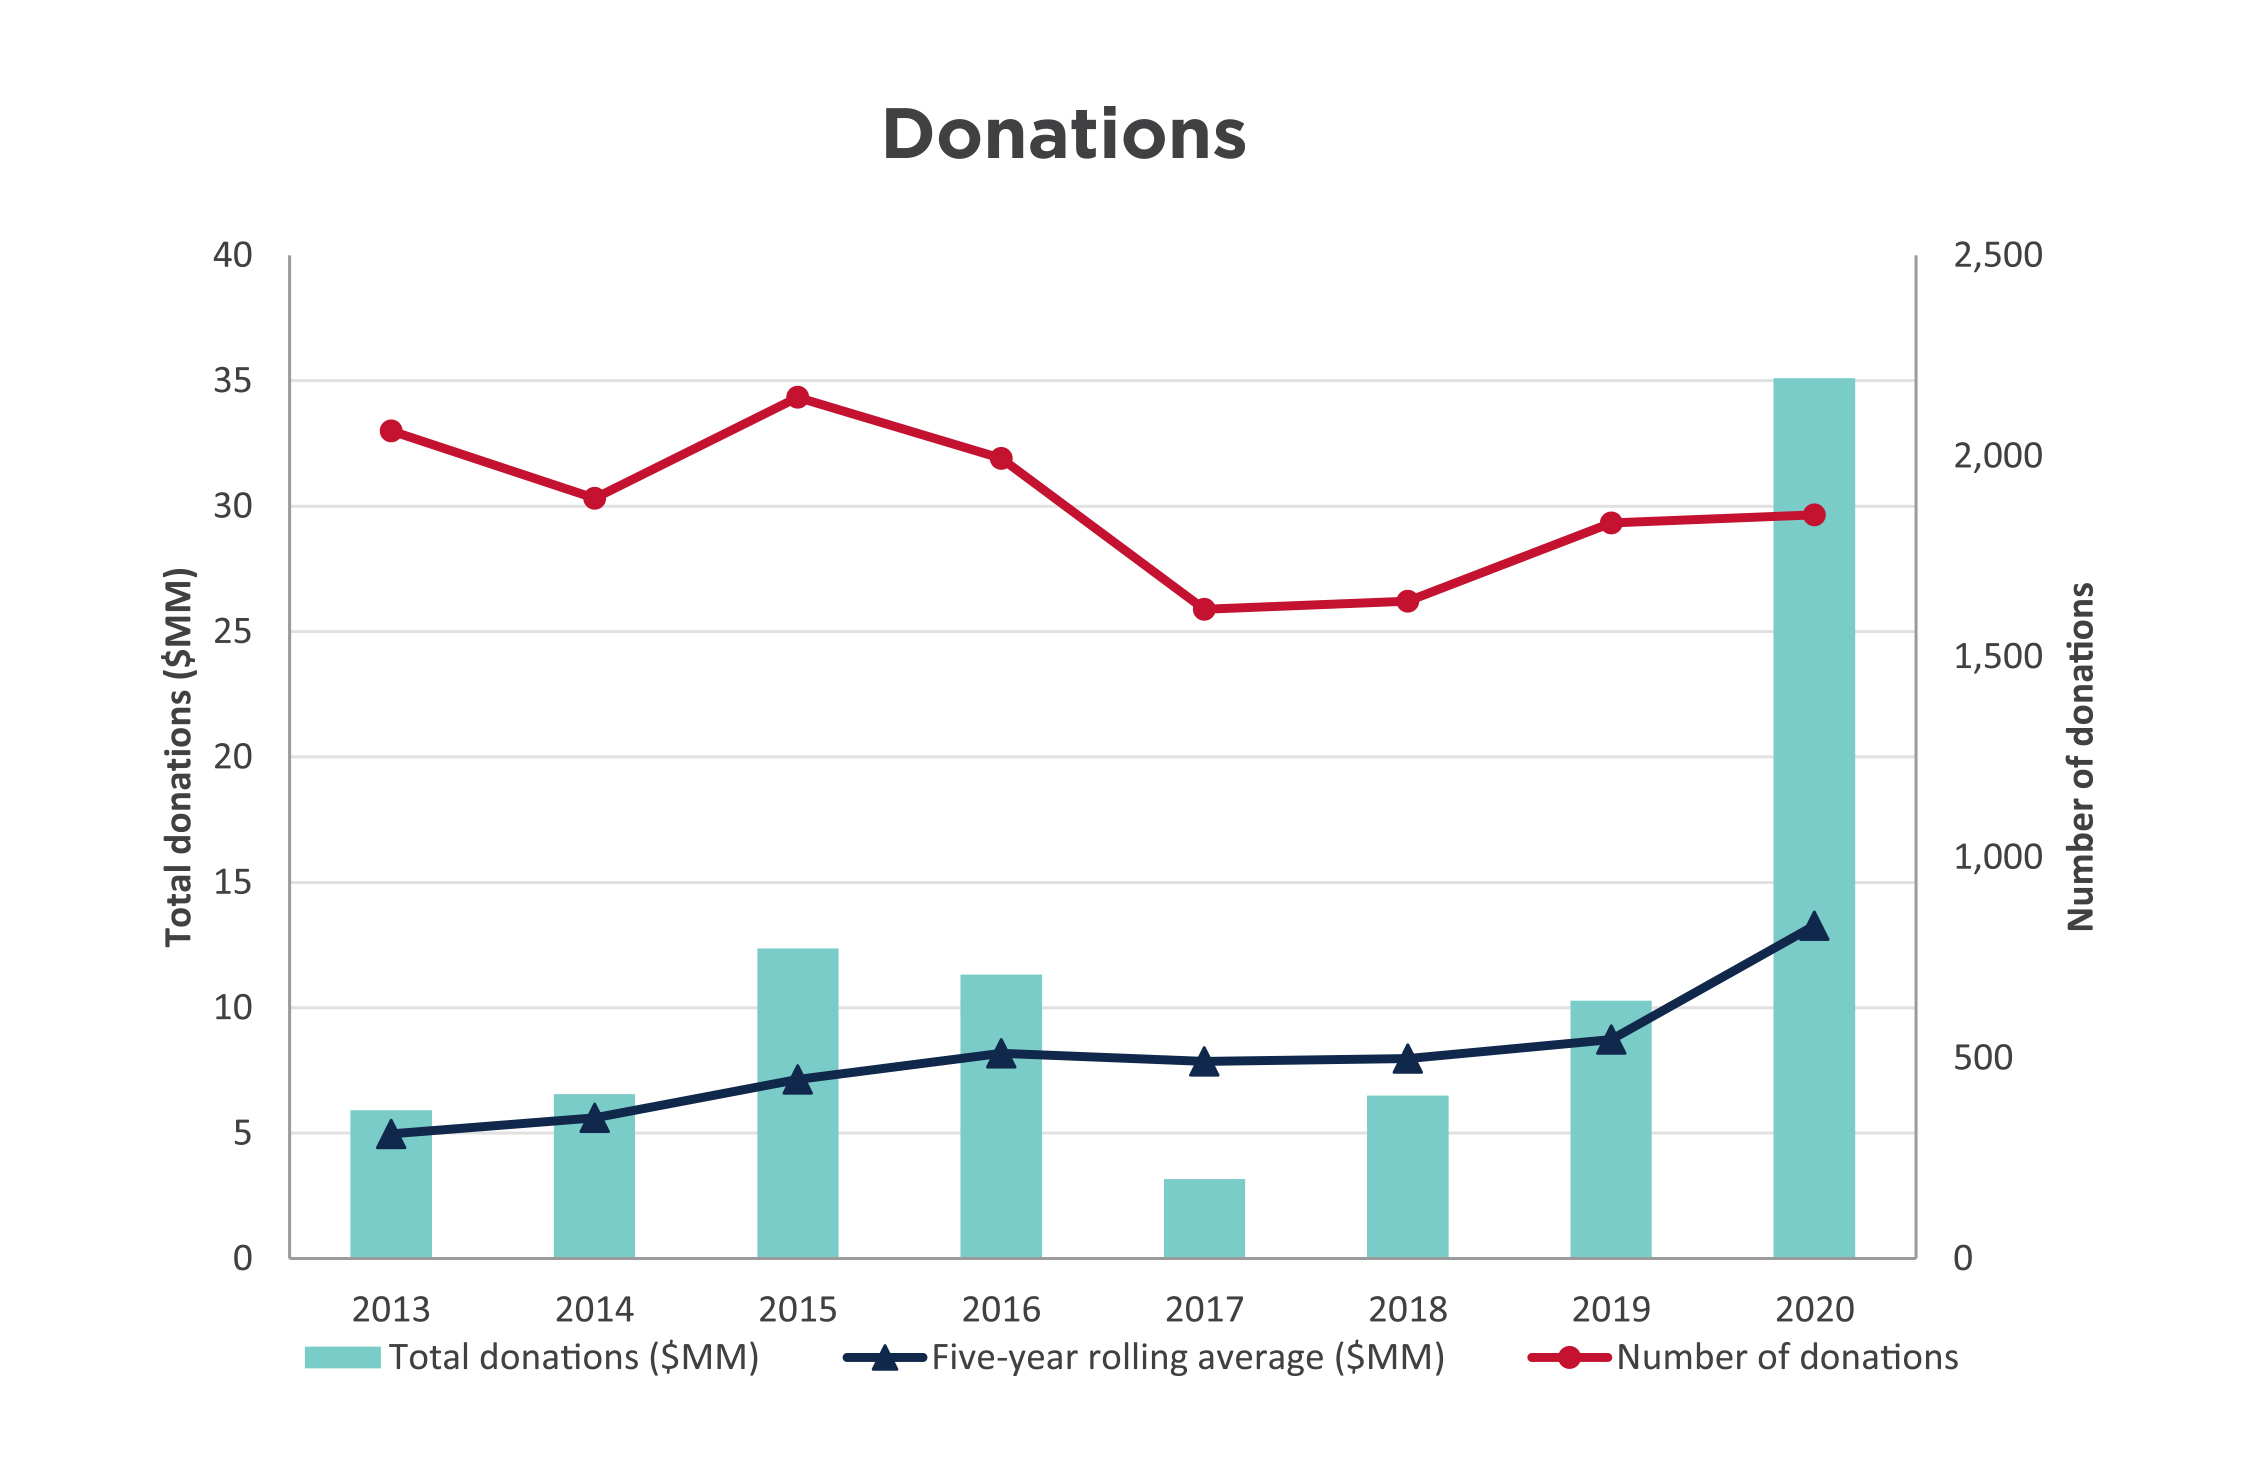
The $35.1 million in donations this year is the second highest total in HCF’s history. Annual donations are influenced by the timing of the realization of donations in wills and significant one-time donations like the $27.7 million in donations of property and private equity. As illustrated in Chart 1, annual donations have ranged between $3.2 and $35.1 million over the past eight years. The five-year rolling average of donations ranges from $5.0 million to $13.3 million over the past eight years.
The five-year rolling average number of donations is 1,787 with 2019-20 at 1,853. The number of donations fluctuates based on “in memoriam” donations and the number and nature of events sponsored by donors to raise money for their funds.
Chart 1
Grants are made annually from both endowed and flowthrough funds. Because flowthrough fund balances are distributed in a shorter time period, granting from these funds can materially influence HCF’s total annual amount granted.
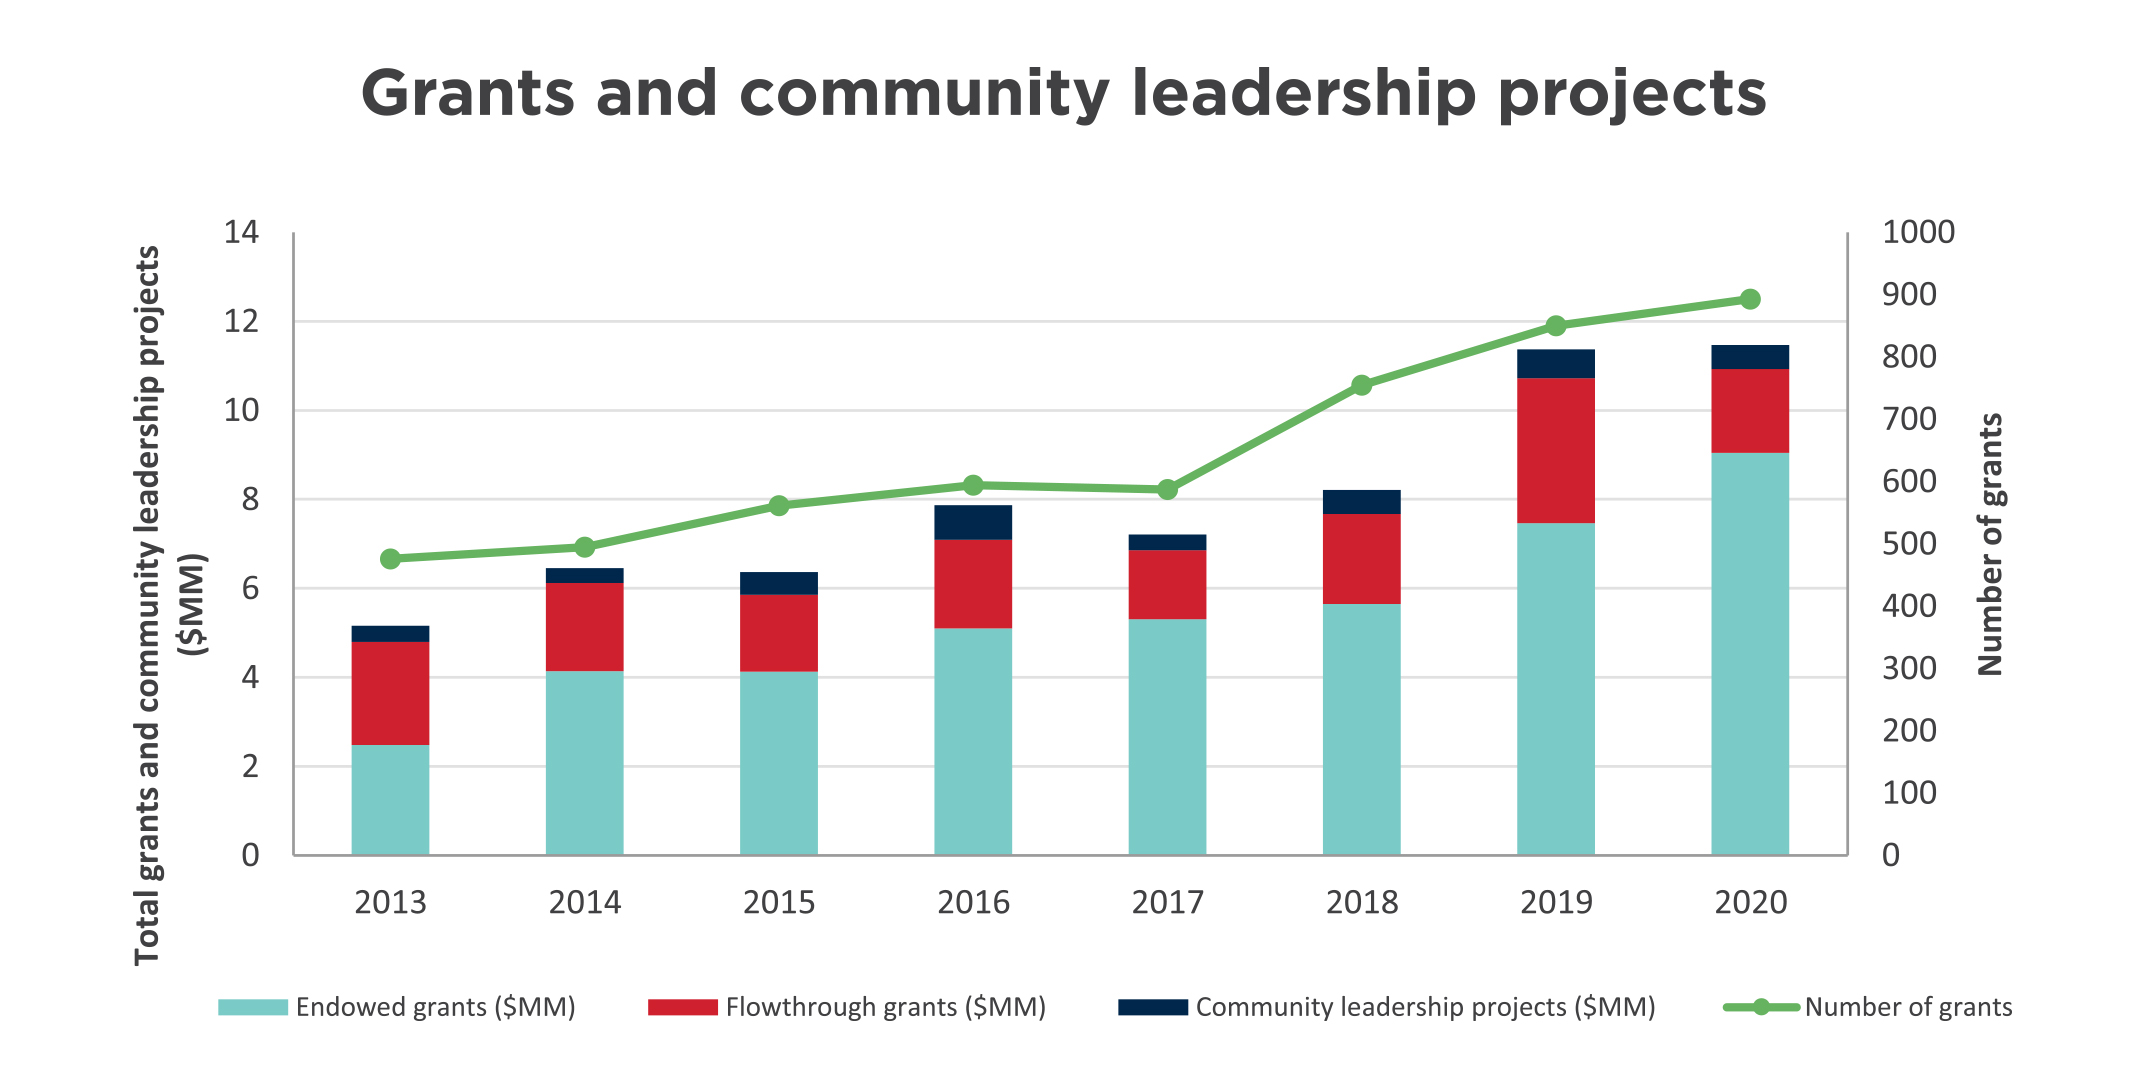
As illustrated in Chart 2, grants and community leadership project spending over the past eight years has ranged from $4.7 million to this year’s historic high of $11.5 million. Granting from endowment funds was reduced in 2013 as a result of the decline in investment returns in 2012 which a) lowered the asset base used for the granting calculation (currently four percent of the fund balances), and b) resulted in less income available to grant. Flowthrough granting and expenditures on community leadership projects has ranged from 22 to 56 percent of total granting in any given year and is dependent on the timing and nature of flowthrough and project activity. At 893, the number of grants for this year is 37 percent higher than the eight-year average.
Chart 2
Investments traded in active markets are reported at fair market value. Investments not actively traded are recorded at their cost less any impairment of their value.
To support our strategy of aligning our assets with our mission and to provide a more diverse and robust portfolio, HCF has committed to investing in alternative asset classes including loans to charities and not-for-profits, private debt, real estate, infrastructure and private equity. These alternatives are consistent with the Foundation’s long-term investment horizon and liquidity requirements. Since these investments are not actively traded, they are valued at cost in the investments. These alternatives total $25.8 million.
HCF invests according to policy guidelines established by the Board of Directors. Two committees of the Board oversee investments to ensure compliance with the policy:
As an endowment builder, HCF’s policy focuses on long-term investing and is supported by reserve accounts that are currently at their policy maximum.
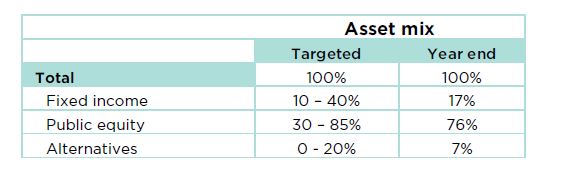
The investment policy sets out a total portfolio target asset mix, as well as a range around these targets. The public market investment managers have mandates within this targeted asset mix and use their discretion to invest the portfolios within this range. Chart 3 reflects the current and target asset mix. Note: $25 million of private equity relates to a fund established by a donor and is not part of the asset mix or the consolidated portfolio results.
Chart 3
Two long-term portfolios are invested in the public markets with Jarislowsky Fraser, and Connor, Clark & Lunn. Chart 4 compares those portfolios against benchmarks as follows:
Benchmarks reflect the performance of each market index based on HCF’s specific target asset mix. Comparing actual results to the benchmark measures the value added by investment managers compared to the average market performance. HCF’s investment policy target is a long-term investment return in the 6.5 to 7.5 percent range.
Chart 4
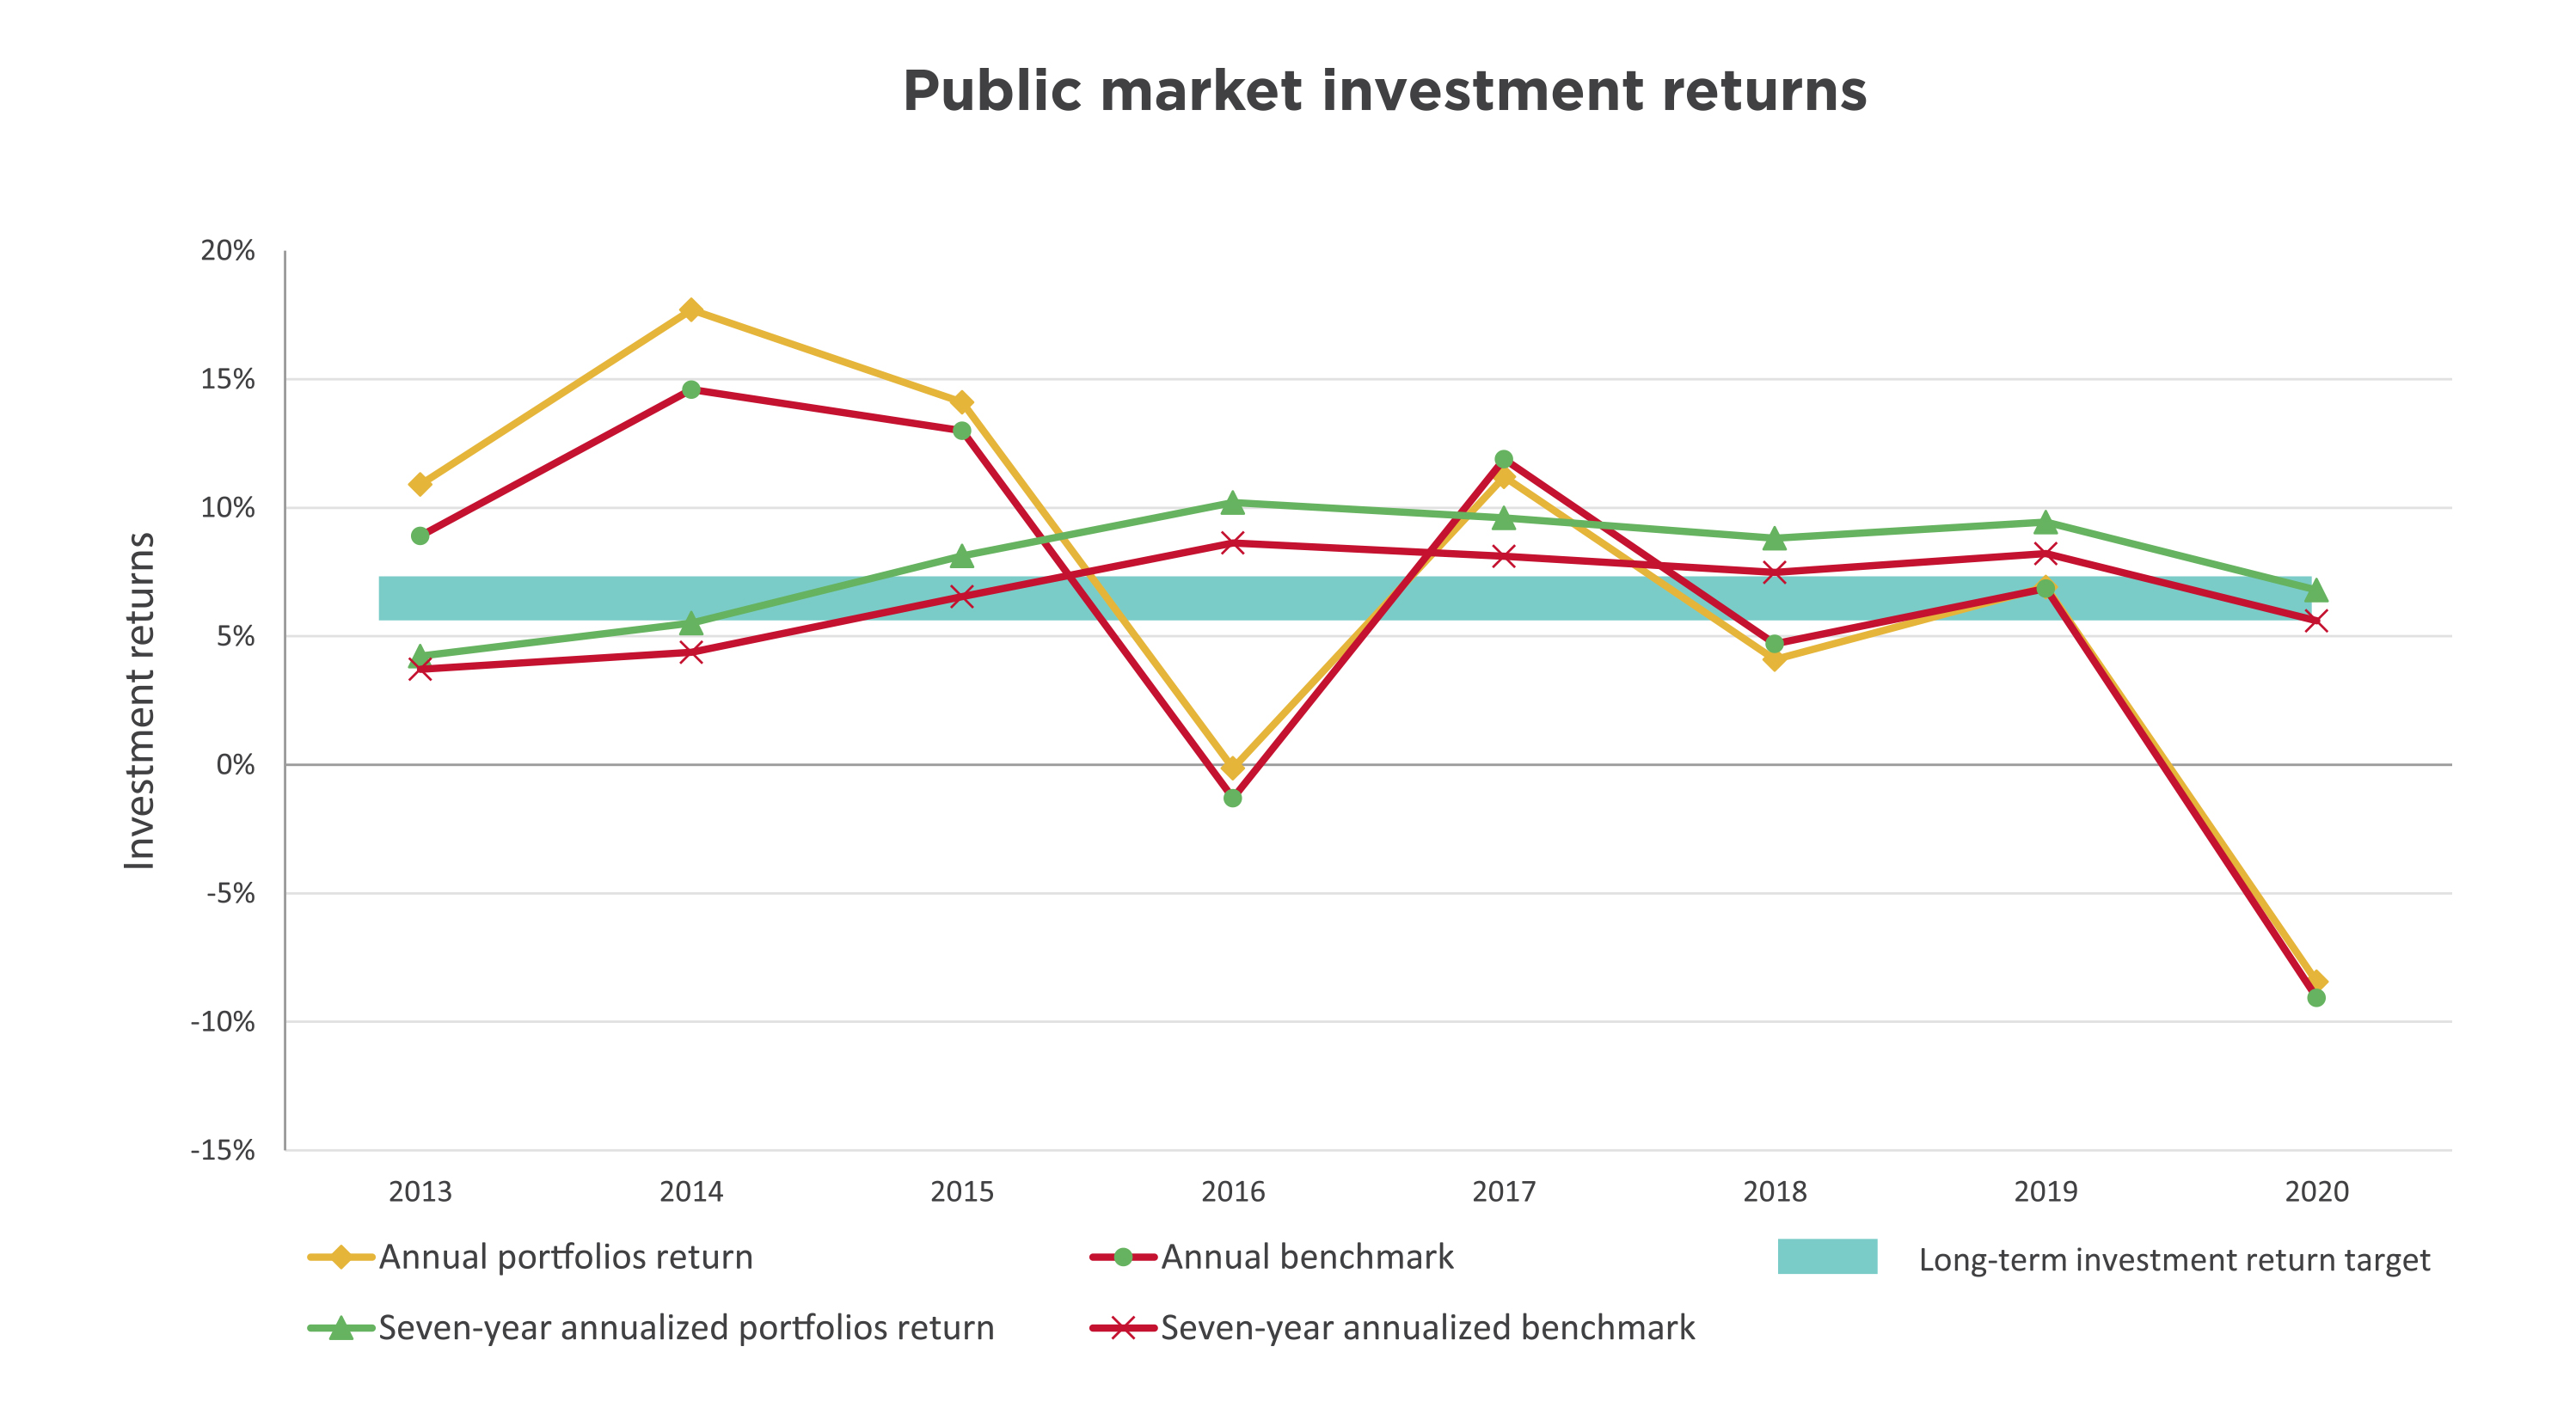
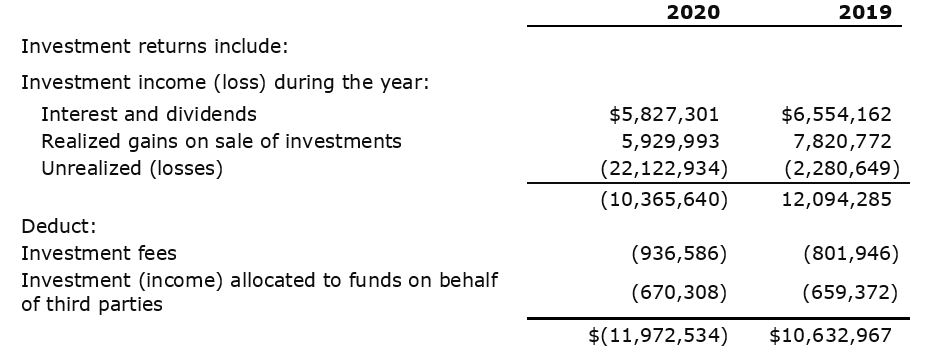
The effect of the global pandemic has materially affected investment returns, resulting in a -8.4 percent public market return for the year. The seven-year annualized return at 6.8 percent is within the targeted investment policy range and is 1.2 percent higher than the 5.6 percent benchmark. As noted in the financial highlights, the current 10-year annualized return of 7.0 percent is in the target range and is higher than the benchmark by 1.2 percent.
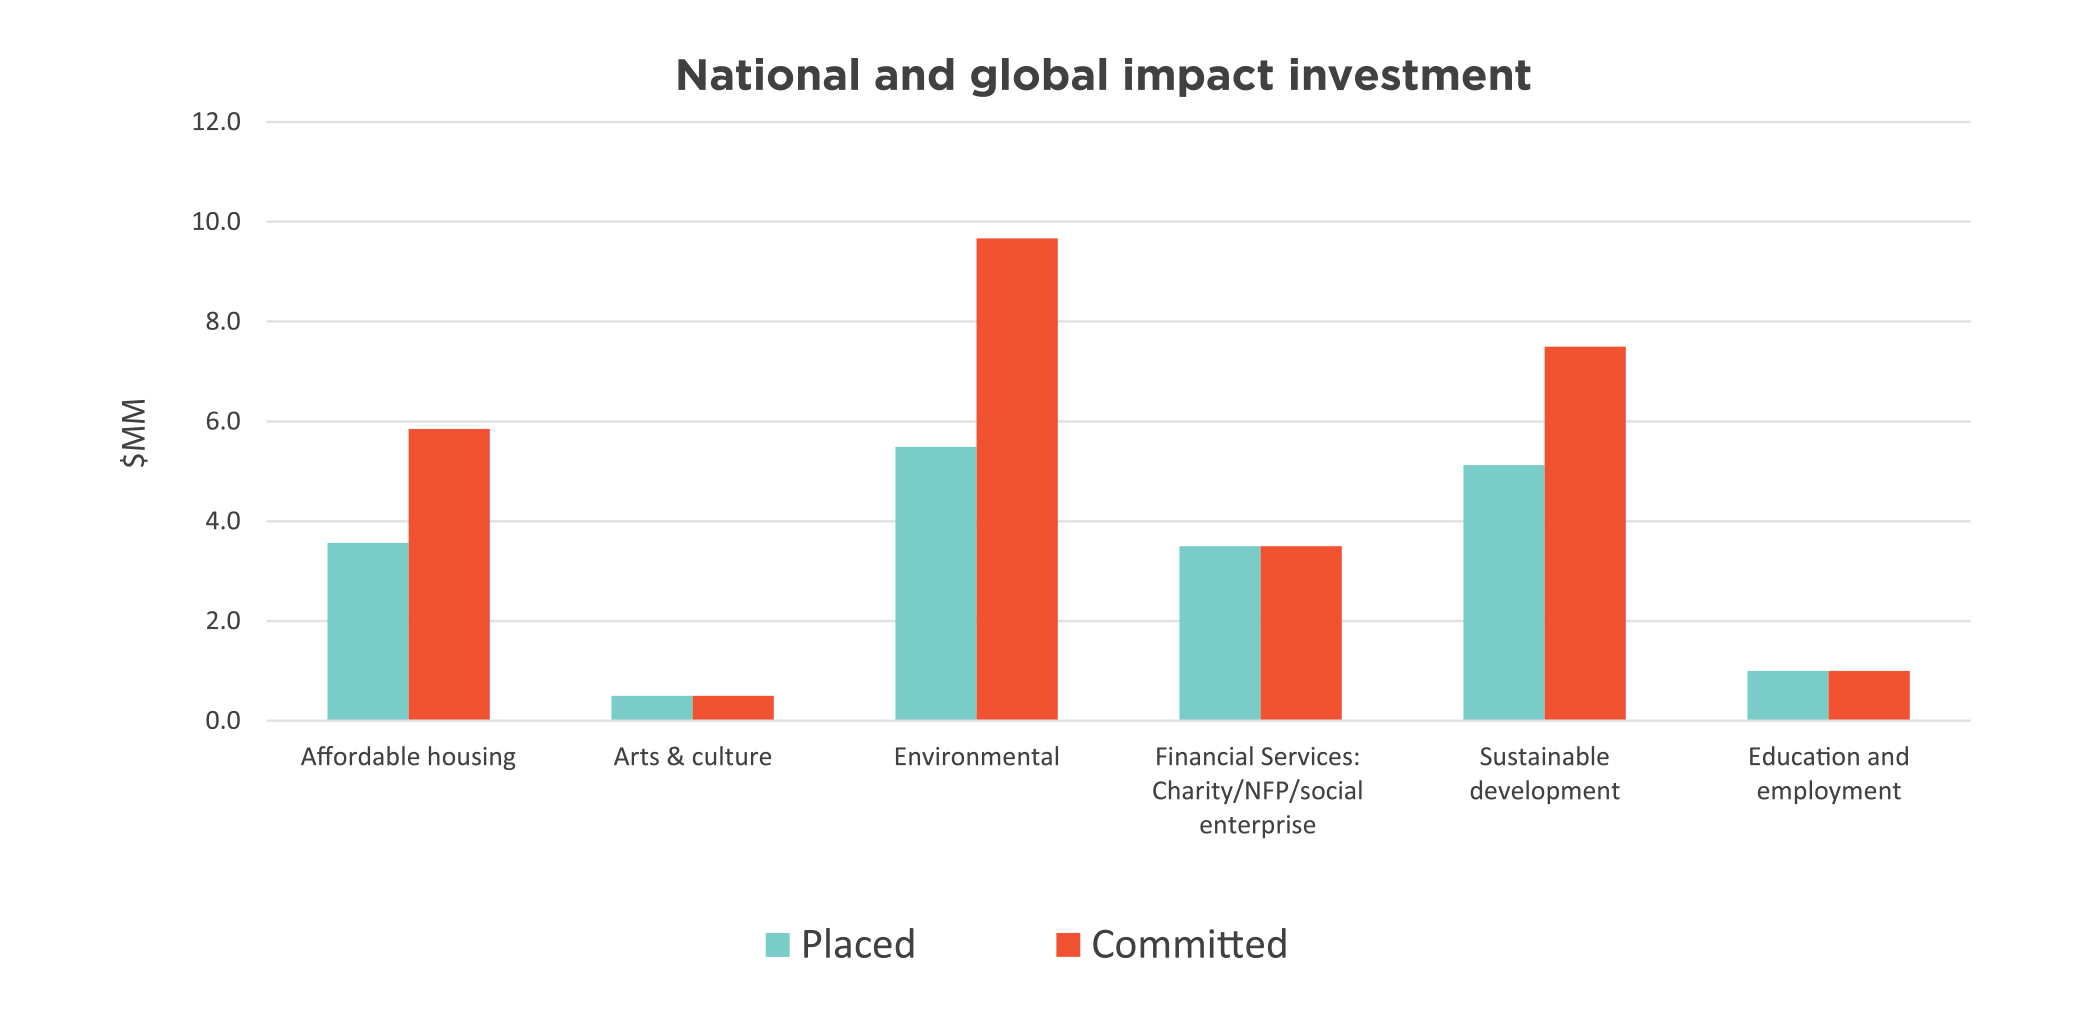
Impact investments enable donations to endowed funds to drive positive change beyond granting, because they represent investments of capital that deliver financial returns coupled with positive social and/or environmental outcomes. In addition, these investments provide a pool uncorrelated to the public markets which, in turn, buffers the portfolio from the volatility currently experienced.
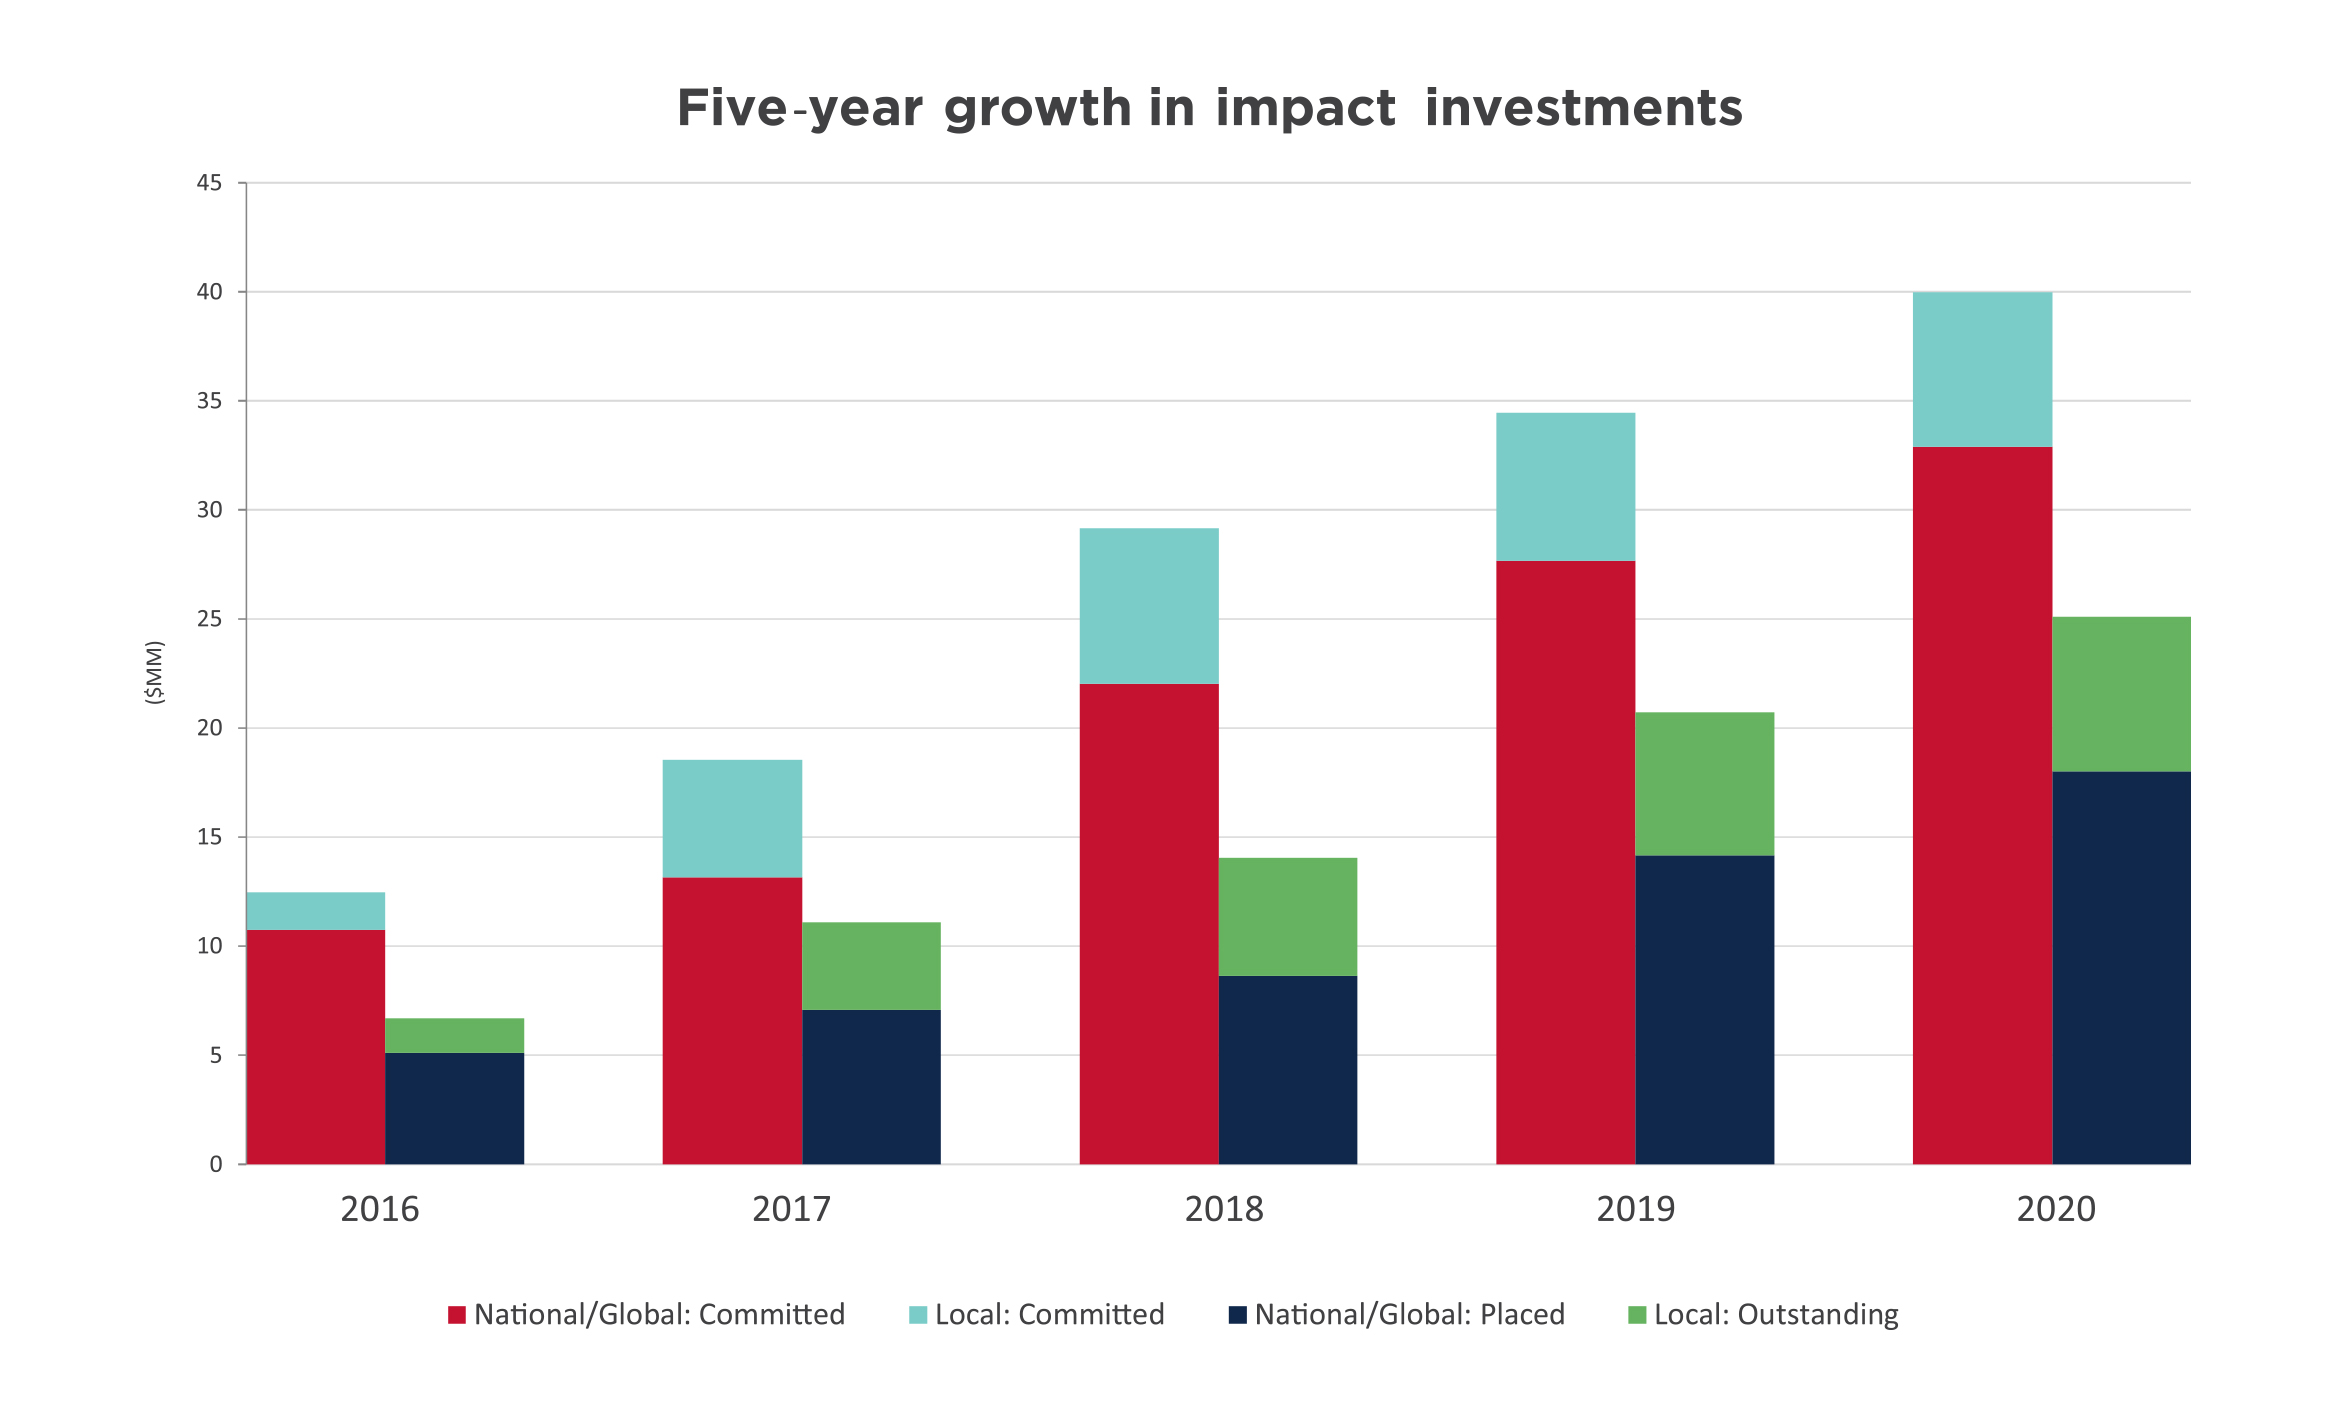
More than 15 percent of our long-term assets are in impact investments. Chart 5 illustrates HCF’s impact investing progress over the past five years, with $25 million currently placed or outstanding and another $15 million committed. This brings the total commitment to $40 million, up from $34 million last year. Impact investments cover areas including affordable housing, arts, environment and sustainable development.
Chart 5
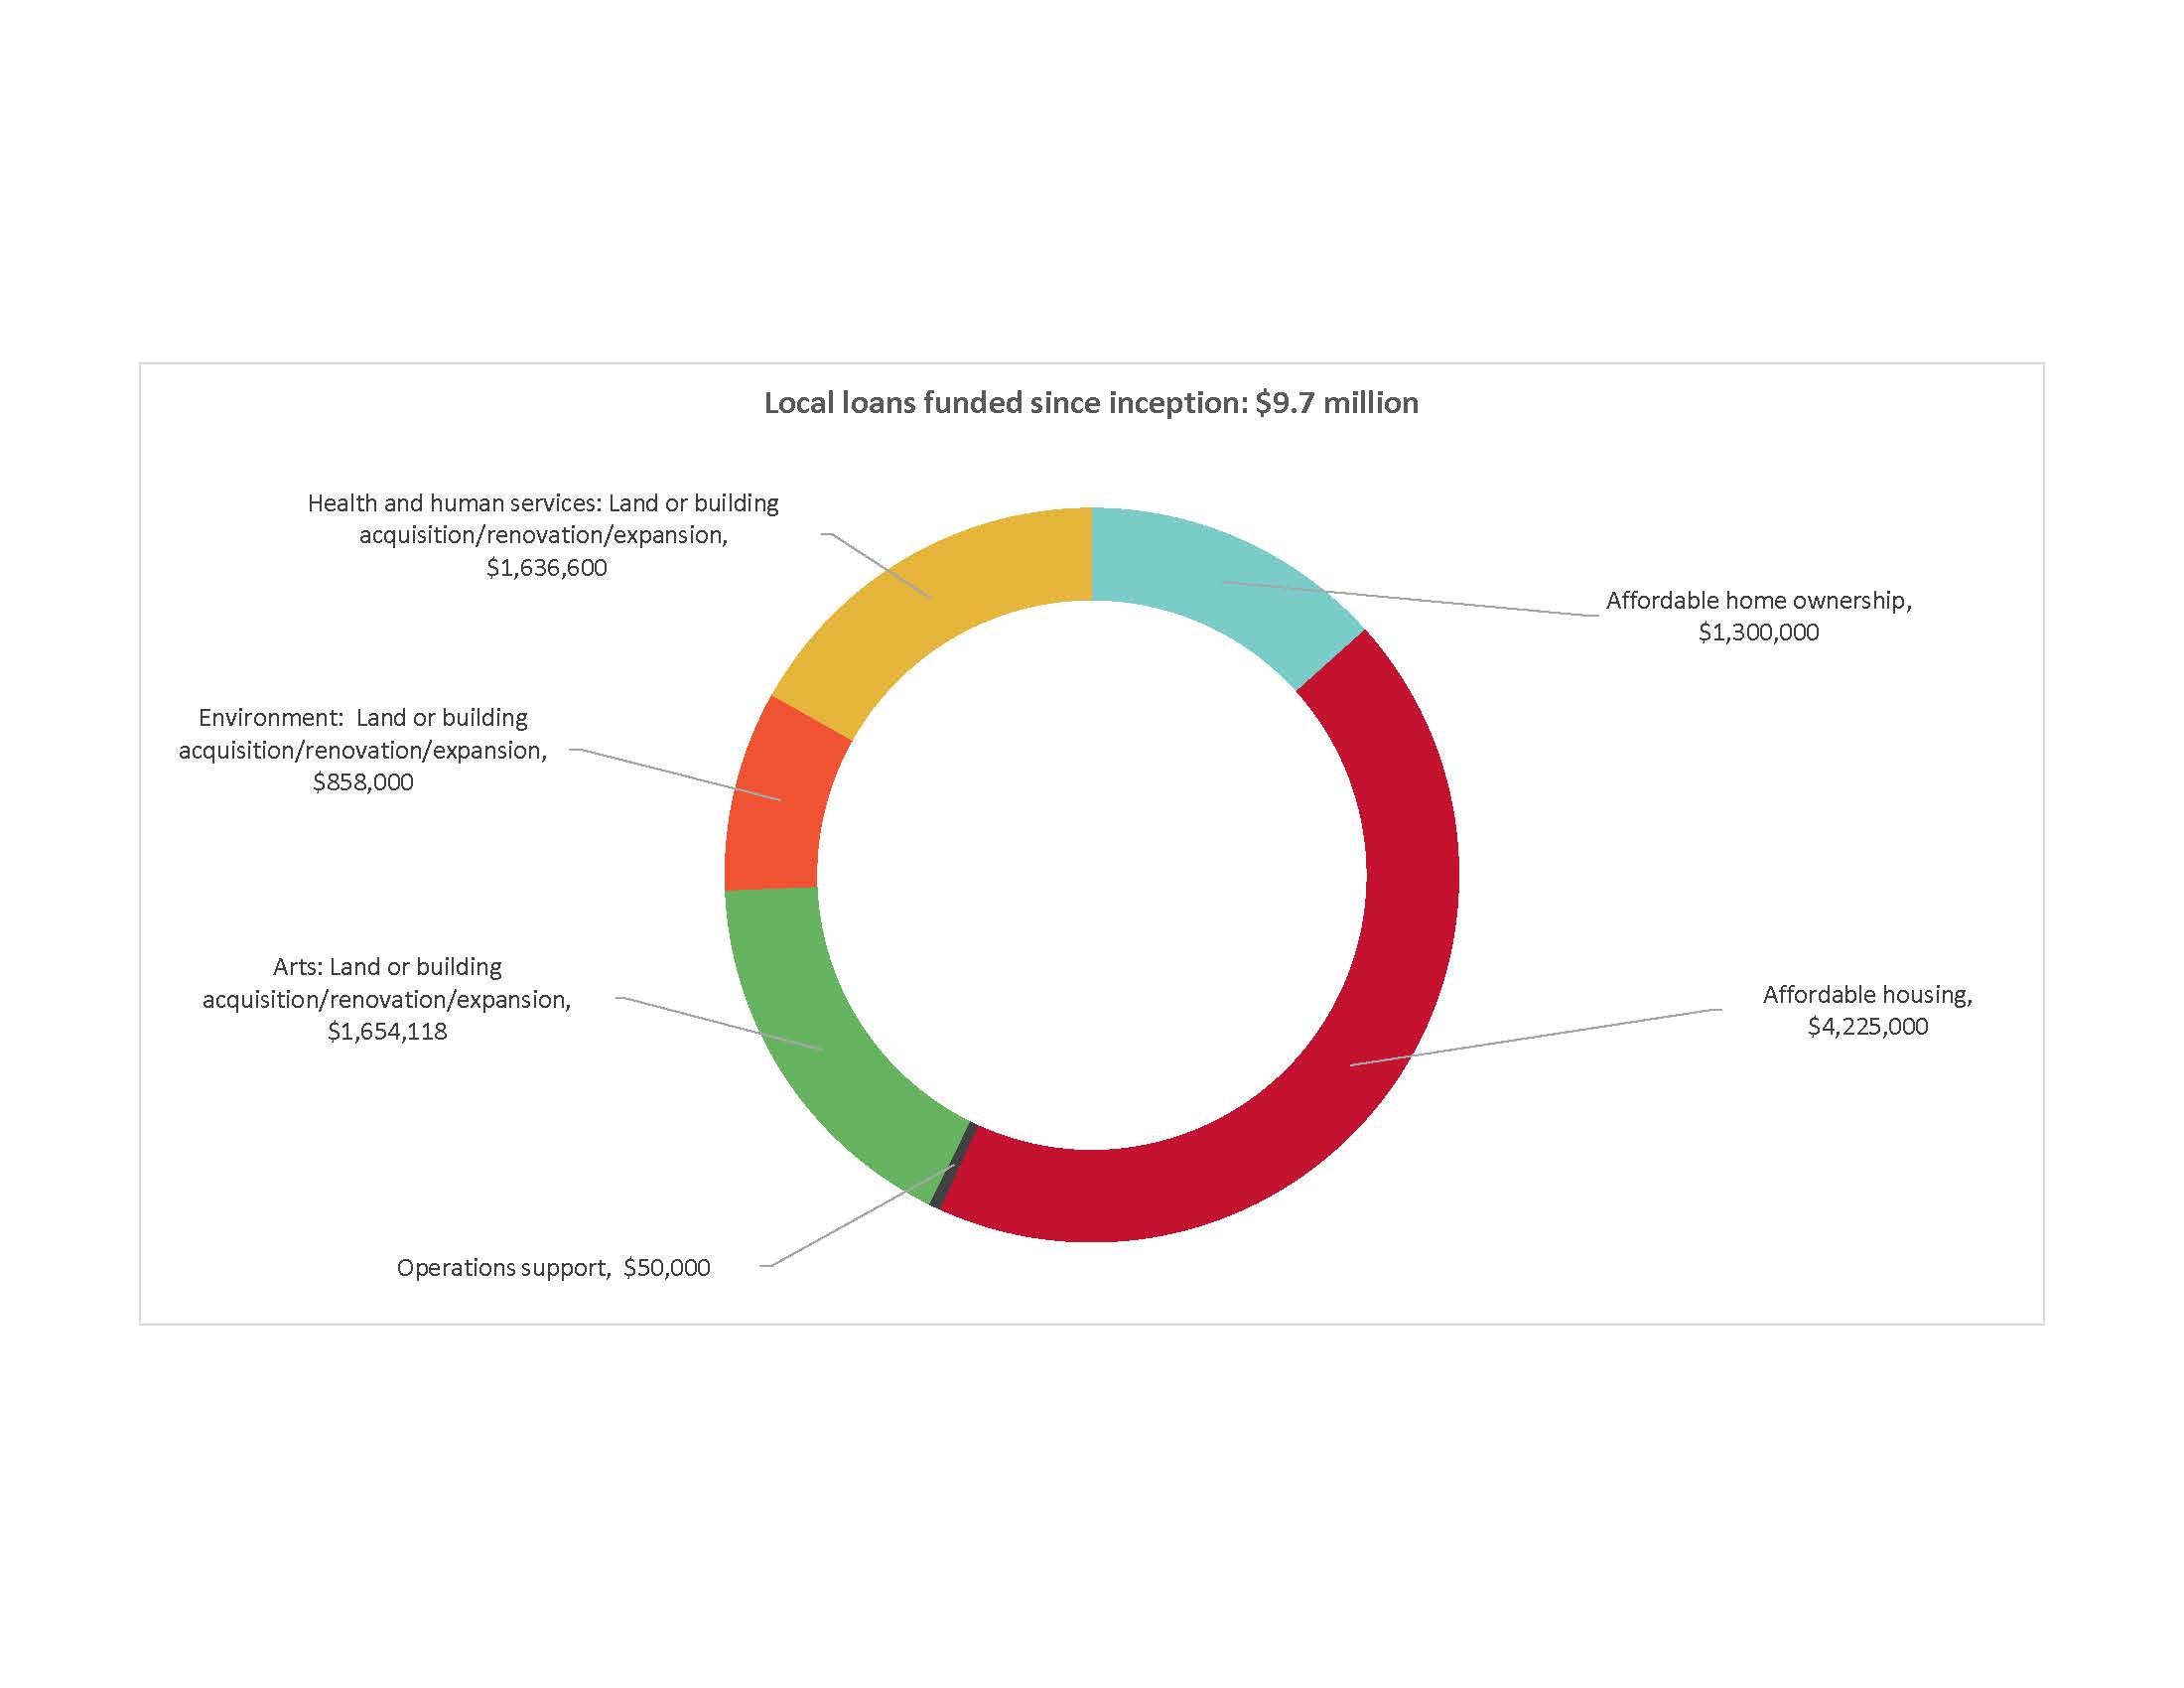
Local loans since inception total $9.7 million with $7.1 million outstanding at year end. Chart 6 shows the impact areas our loans have supported. Since the loan program’s 2012 inception, $2.6 million in loan principal has been repaid and recycled as new loans. In addition, the interest from these loans supports HCF granting.
Chart 6
IRP is a Government of Canada program being delivered nationally by partners including Community Foundations of Canada. As the first phase in the government’s long-term investment in social finance, the IRP’s goal is to make social-purpose organizations “investment ready” so they can make a difference in new and innovative ways through their participation in the social finance market. HCF has partnered with community foundations in London and Niagara, and the McMaster Innovation Park to manage the program regionally on behalf of Community Foundations of Canada. The first request for proposals for funding in January created enormous interest nationally and garnered 65 submissions to our regional partnership. Approved funding is expected to be released in June 2020. As an additional benefit, the IRP brought a growing number of potential opportunities for local loans to HCF’s attention.
These investments include private equity, private debt and real estate investments. Many of these investments are long term in nature, are maintained at cost and do not have a regular income stream. As these investments are maintained at cost, their results include interest income and realized gains, but not unrealized gains. Results for these investments are closely monitored and are reported when realized. Chart 7 identifies the investment areas, with $18.0 million placed and a total commitment of $33 million across 21 investments.
Chart 7
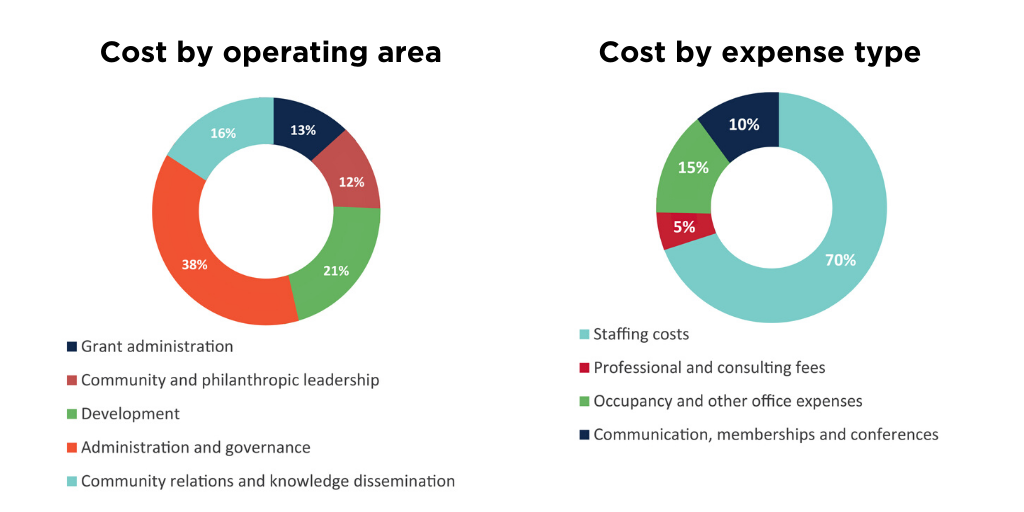
Operating expenses for the fiscal year ended March 31, 2020 total $2.5 million and were 2.5 percent higher than last year. Staffing costs related to the Foundation’s 22 employees represent 70 percent of HCF operating costs.
In addition to breaking out cost by type, operating costs are allocated to each of the Foundation’s operating areas: grants administration, community and philanthropic leadership, community relations and knowledge dissemination, development activities, and administration and governance. Examples of community and philanthropic leadership include convening around the city’s critical issues and fostering the growth of philanthropy by sharing staff time and knowledge to support other charities. Charts 8 and 9 illustrate these costs by operating area and by expense type.
Charts 8 and 9
The Foundation’s annual development expenses are not necessarily attributable to the donations received in that year. The nature of donations to the Foundation can result in costs preceding the receipt of the donation by several years (for example, donations through wills). As a result, consistent with the community foundation sector, operating costs are evaluated by a ratio of total operating expenses to average total assets. Ratios fall within a range depending on the size and stage of the community foundation’s development.
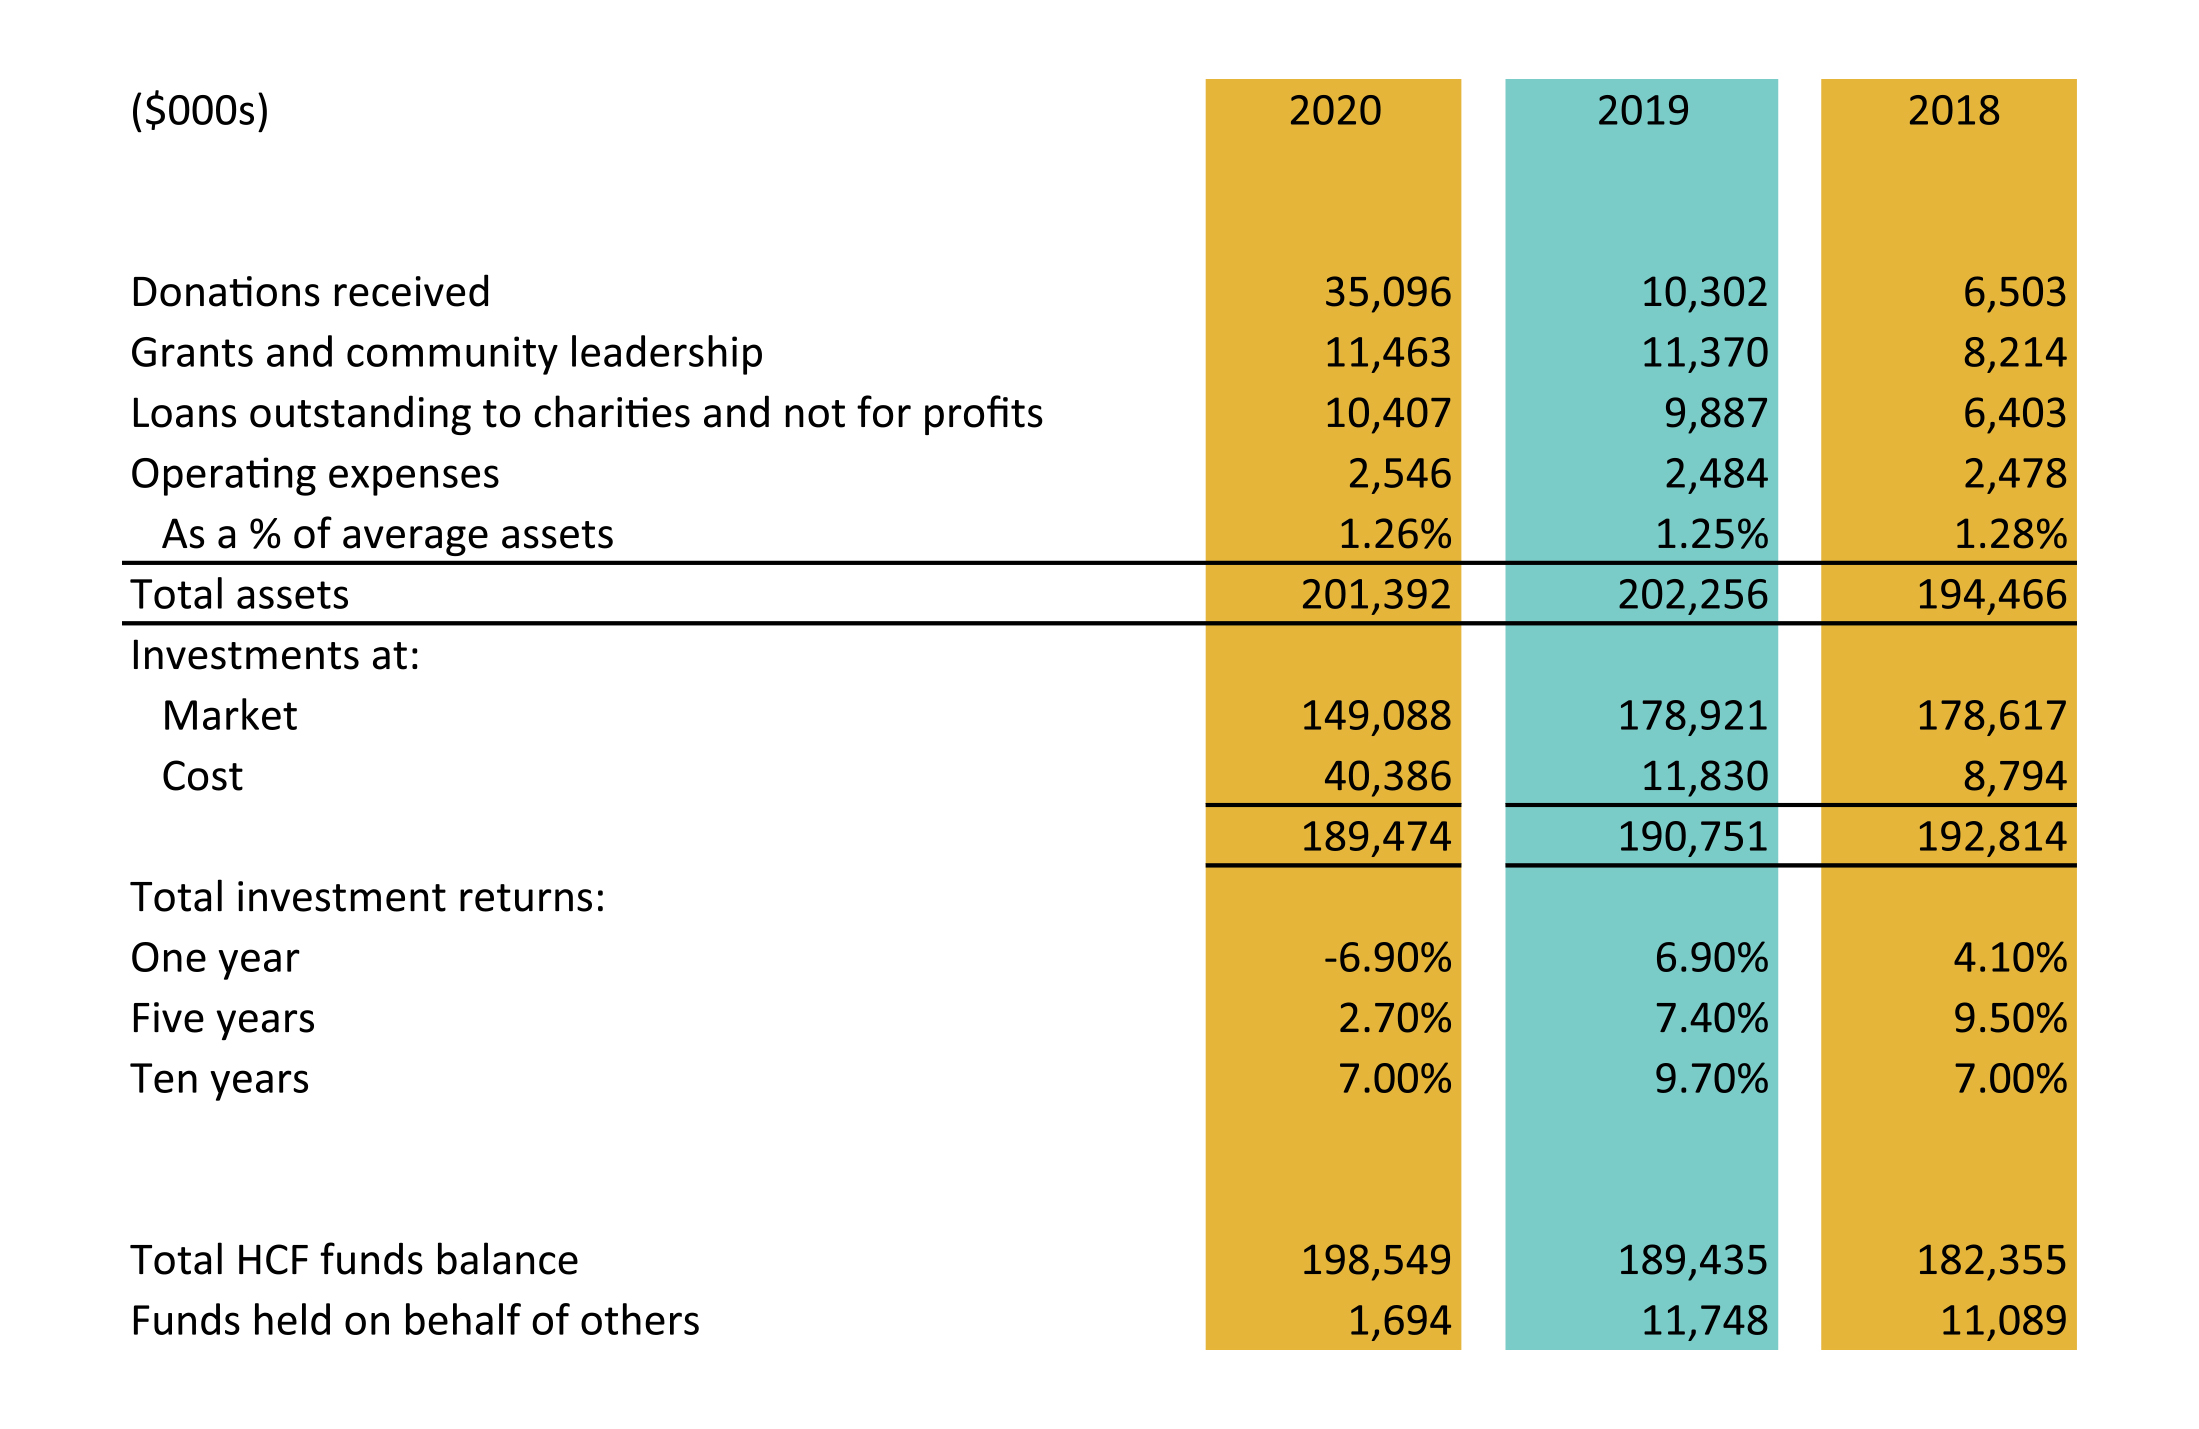
Management considers the ratio of 1.26 percent (1.25 percent in 2019), as illustrated in Chart 10, to be within an acceptable range for a foundation of HCF’s size, stage and level of community leadership, compared against benchmarks established in the community foundation sector. We continue to monitor both the actual results and the benchmarks on an ongoing basis.
Chart 10

Hamilton Community Foundation’s total assets of $201 million at March 31, 2020 include balances of HCF funds and funds held on behalf of others at $1.7 million.
Hamilton Community Foundation’s fund balances, illustrated in Chart 11, represent accumulated donations plus the net investment earnings on these donations, minus granting and operating costs. Funds include both endowed and flowthrough funds. Endowed funds are held permanently and grant from investment earnings. Flowthrough funds are fully distributed as grants over a pre-determined term.
Chart 11
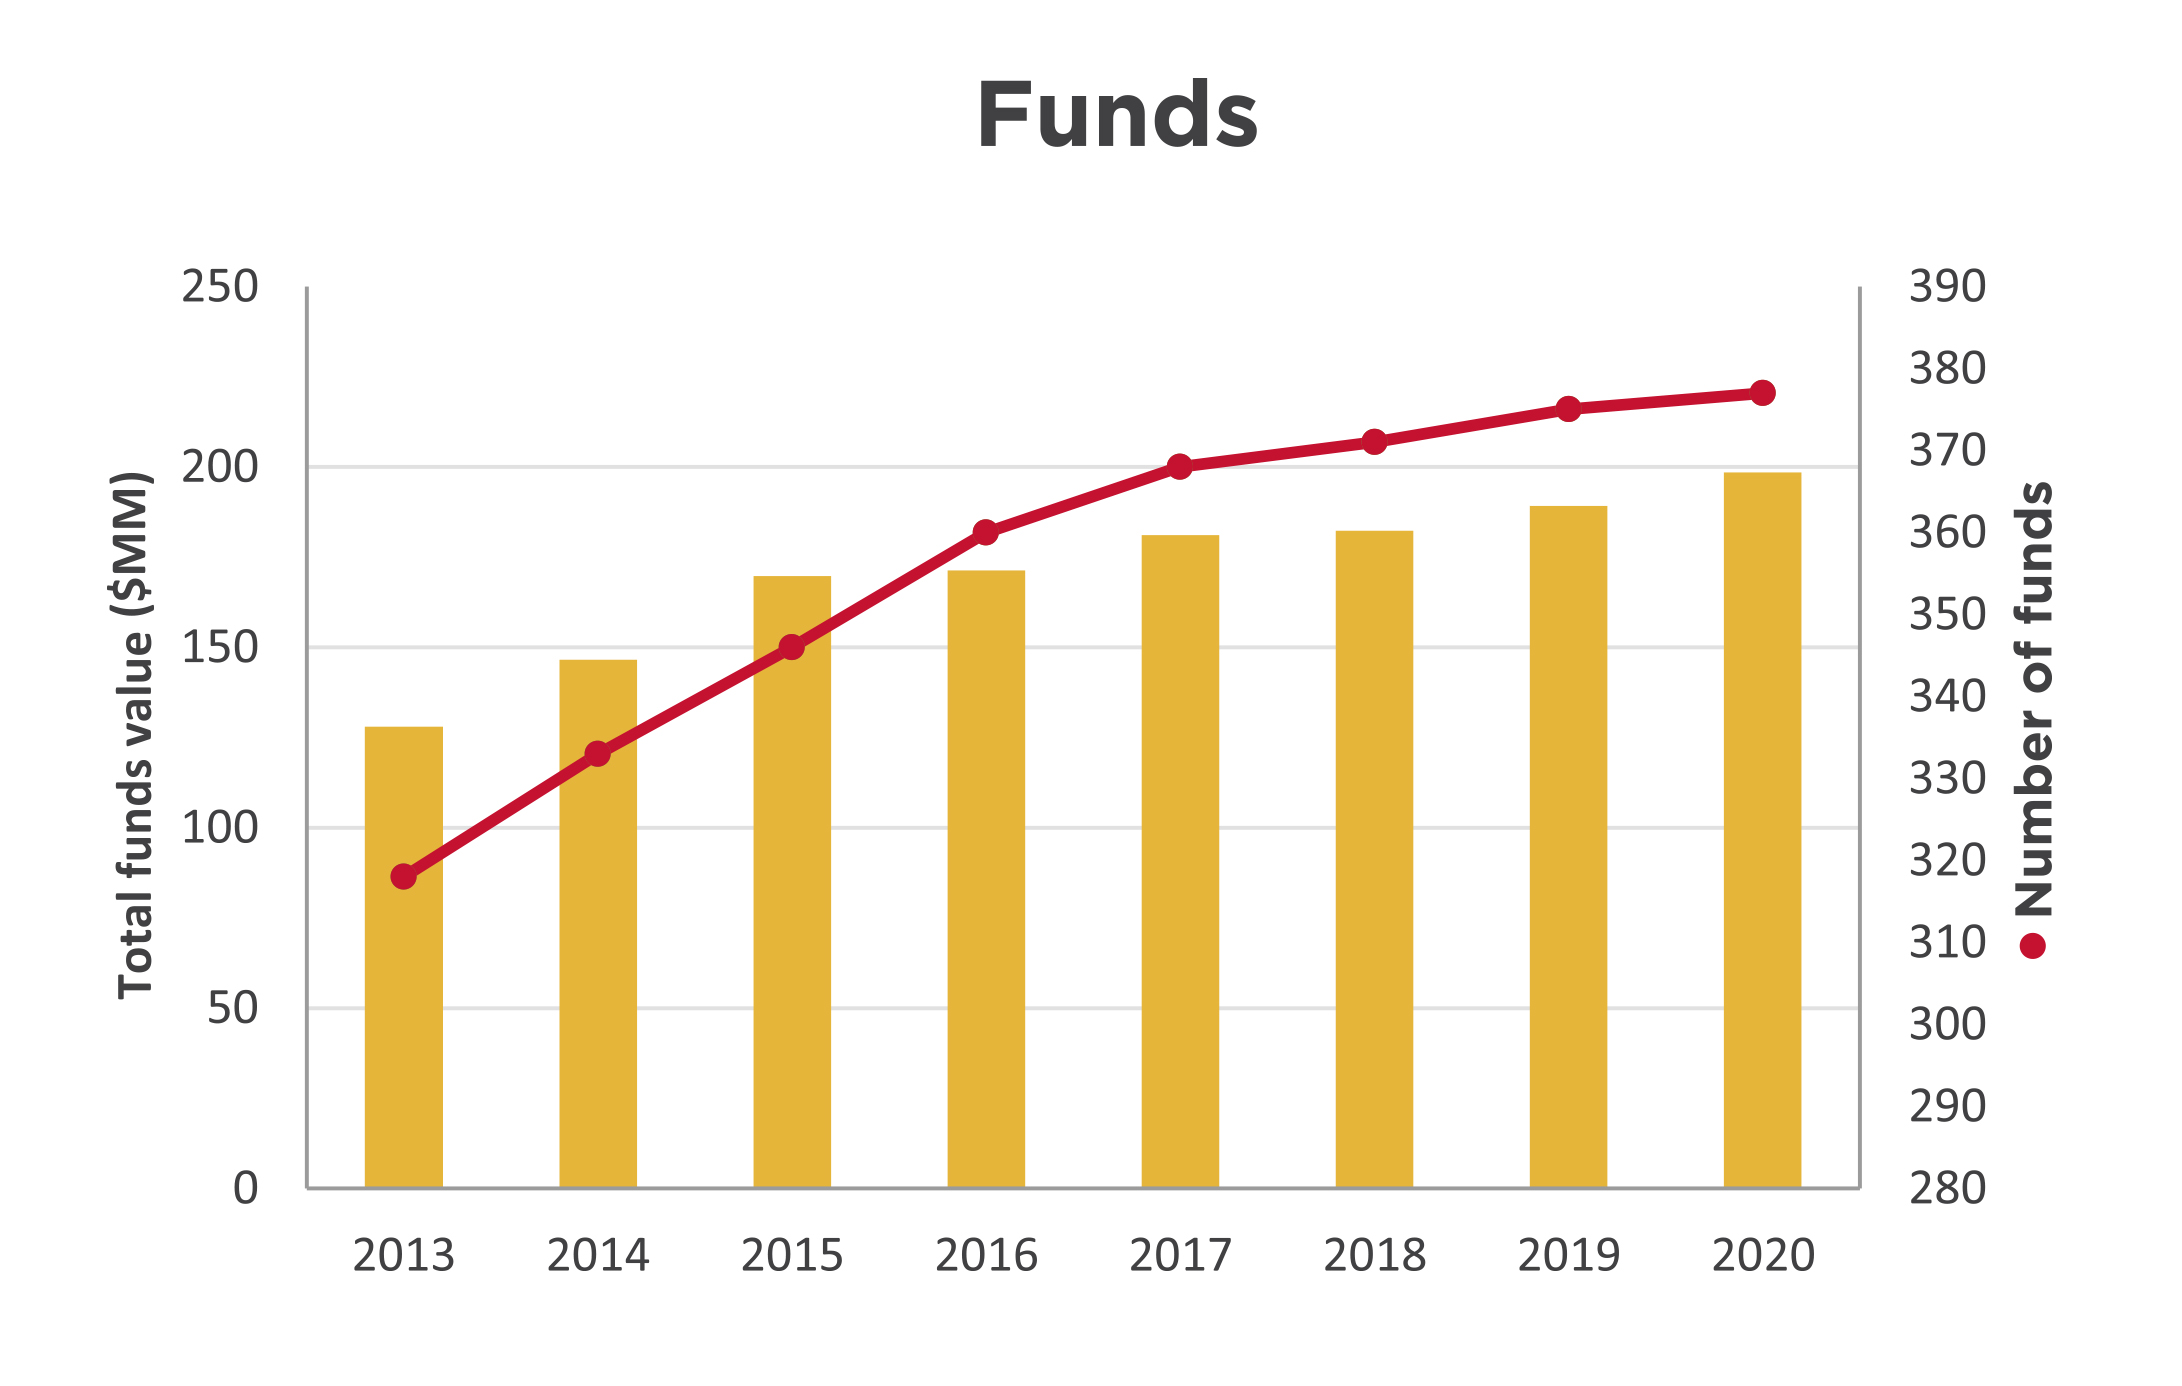
The fund balances have grown 55 percent to $198 million at the year ended March 31, 2020 from $128 million in 2013. Donations of $35.1 million included $4.4 million in flowthrough donations that were largely distributed as grants in the year and, as a result, do not remain in the fund balances at year end. This results in a modest total funds balance growth of 4.8 per cent for the year. The number of funds has grown 19 percent to 377 from 318 in 2013.