Hamilton’s economic renaissance is not addressing the larger barriers that many people face when seeking employment. A lack of affordable high quality child care spaces, deep poverty, and discrimination in the labour market all continue to create very unbalanced outcomes for many of Hamilton’s citizens.
A major challenge for many parents entering the labour market is finding high quality childcare that fits their schedule and budget. For many women this is a pressing issue, as women are three times as likely to be lone parents as men (2011 Census), and women provide twice as much unpaid childcare as men in two parent homes (Statistics Canada’s 2009 General Social Survey). For workers in insecure employment, the challenges are magnified. Chart 29 shows that for almost 4 in 10 insecure workers with children, access to childcare limits their ability to work, compared to less than 1 in 10 secure workers.
Chart 29. Interactions between employment and childcare, workers aged 25-65 with children, by employment security categories, City of Hamilton, 2011 and 2014 (combined)
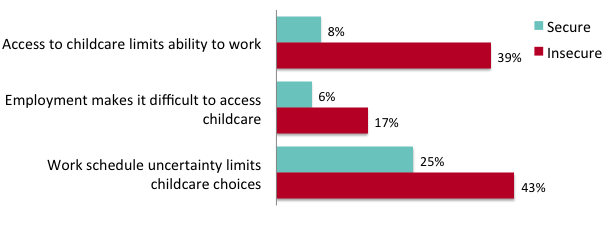
Data source: McMaster University and United Way Toronto, Poverty and Employment Precarity in Southern Ontario (PEPSO) data file, (2011 and 2014).
In a survey of Hamilton’s parents of children in kindergarten, cost was cited at the most common barrier to finding childcare (cited by 35% of parents, and 38% of the lowest income parents). Chart 30 shows the difficulties cited by low-income parents more often than the overall average of all parents.
Chart 30. Selected difficulties when looking for childcare parents of children in kindergarten, by very low income and all incomes, City of Hamilton, 2010
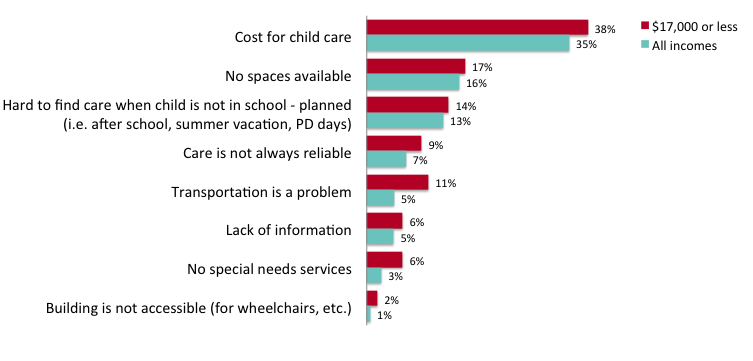
Data source: City of Hamilton Early Years Research Team. Kindergarten Parent Survey
The declining benefit rates of Ontario’s main social assistance program, Ontario Works, have made it harder and harder for recipients to focus on anything but basic day-to-day survival. With a net gap of 25% between adjustments to assistance rates and the rising cost of food and shelter since 1986, rates have not kept up with the cost of living (chart 31). Ontario Works clients are reliant on food banks and other charitable programs to meet their basic needs, taking time and energy away from any job search.
Chart 31. Change in social assistance for a single person on Ontario Works compared to increases in cost of food and shelter, 1986-2014
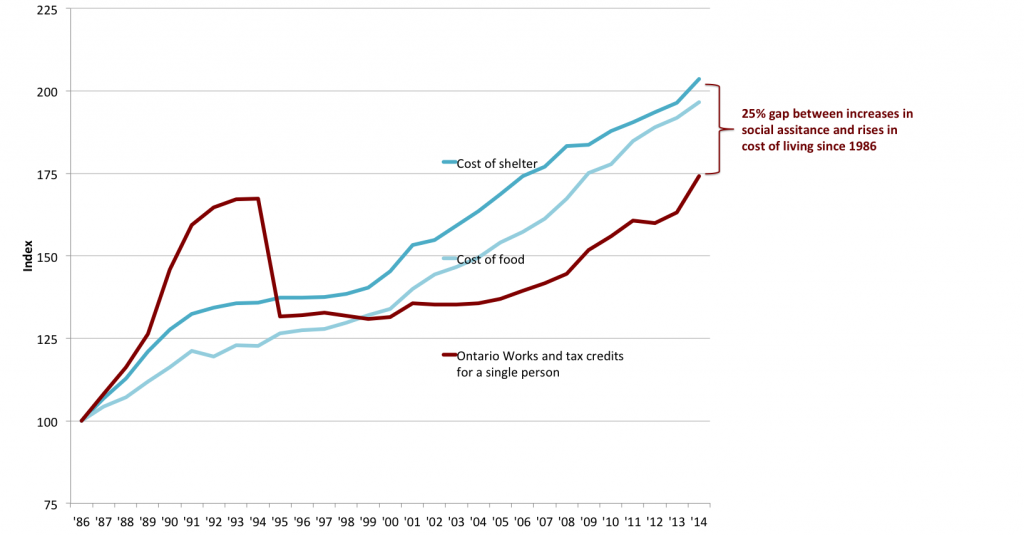
Data sources: Caledon Institute of Social Policy (Welfare in Canada, 2014), Statistics Canada (Consumer Price Index, 2014)
There is clear evidence that living in poverty, especially deep poverty experienced by those on social assistance, leads to illness and makes finding a job more difficult. The ODSP Action Coalition attributes some of the rise in the Ontario Disability Support Program to the low OW rates:
“ODSP caseloads are in part a reflection of the inadequacy of Ontario Works. Prolonged periods on OW, with its dangerously inadequate benefits levels, often result in a serious decline in health. Unaddressed, declining health can lead to serious disability, which makes full-time gainful employment unlikely or impossible. Thus, people who have spent a long time on OW can find themselves disabled, where their only option is to turn to ODSP for support.”
In a 2010 client survey of Hamilton residents receiving Ontario Works benefits one of the most common suggestions for improvement was increasing support for people as they try to gain entry into the labour market, as the current low social assistance payments add additional challenges to find employment:
“There needs to be more money made available to those seeking employment. [The] basic needs [benefit] does not cover both food and transportation.”
“If they could up what a single person gets, that would be good for all involved. I get it you guys don’t want people to get too comfortable living on ‘OW’. But sometimes it comes down to clean clothes or not. Therefore making job searching impossible. No one wants to go out looking for a job in dirty or inappropriate clothes. Funds are limited therefore making life limited.”
“I believe that sometimes is not black and white when it comes to rules and that sometimes different circumstances change rules. Single parents need support and I find the system is not ideal when dealing with this. I’m a single mom and I received every road block there could be to seek employment. I did it cause I’m strong but that’s not the case for every single parent.”
The experience of racism in Canada’s labour market is pervasive and is a major barrier for persons of colour or persons with non-English sounding names to getting hired.
Recent studies by University of Toronto economics professor Phillip Oreopoulos of 20,000 fictitious resumes sent in response to job ads across 20 occupational categories found that Canadian employers were 35% to 40% more likely to call English-sounding names for an interview, compared to foreign-sounding names, despite identical resumes otherwise with 4-6 years experiences and a bachelor’s degree.
Follow-up interviews by Dr. Oreopoulos’ team found that employers justify the discrimination because they make assumptions about level of English proficiency just by judging a person’s name. However, the research showed that the degree of discrimination was found to be the same even if the job did not require high proficiency in English, or if applicants were identified as Canadian born.
Many other types of discrimination are also barriers to finding work, many which are prohibited by the Ontario Human rights code, including gender, age, sexual orientation and disability. Since there are so many people looking for work for every job opening, employers have been found to discriminate on more subtle grounds which are not protected by legislation), such as appearance including facial features, weight, height, tattoos and piercings.
Interviews by Dr. Oreopoulos’ research team with employers helped to document the type of ‘cultural shortcuts’ that occur, leading to racism and discrimination.
Employers stated for example:
“You know that you can call Bob Smith, and you can talk to him as quickly as you want to. It’s less work because you know that his English will be fine. It also indicates that he’s white looking. The brown guy who was born here is not less desirable in the workplace, but it takes something more to know for sure that he speaks English without an accent. We’d have to make a phone call and test the water.”
“People who have immigrated to Canada tend to be harder workers, so are preferable hires, although it’s difficult to imagine hiring someone with a long first name, as it might be impractical in terms of answering the phone and saying it. People with easy-to-use shorter names are easier to hire and work with.”
“I personally am guilty of gravitating towards Anglo names on resumes and I believe that it’s a very human condition –[a result of] resistance to change.”
“[People] are surprised that a woman has a position like this in a menswear company, and they ask me where I’m from, and if I’m Catholic. It feels insulting. Yes, discrimination exists in professional interactions including hiring, even if we don’t want to acknowledge it.”
In Hamilton, construction and public administration have the lowest representation of visible minorities in Hamilton, with just 8% and 9% respectively, while 14% of Hamilton’s labour force is made up of persons identifying as visible minorities (chart 32). Even though Hamilton’s visible minority population is better educated than the average across the city, according to Statistics Canada’s 2011 National Household Survey, occupations that require generally less education such as manufacturing and accommodation and food services are among the industries where there is a higher representation of visible minorities (17% and 19% respectively). Many of these findings are similar to trends across Ontario.
Chart 32. Proportion of workers who identify with a visible minority group by industry, City of Hamilton, 2011
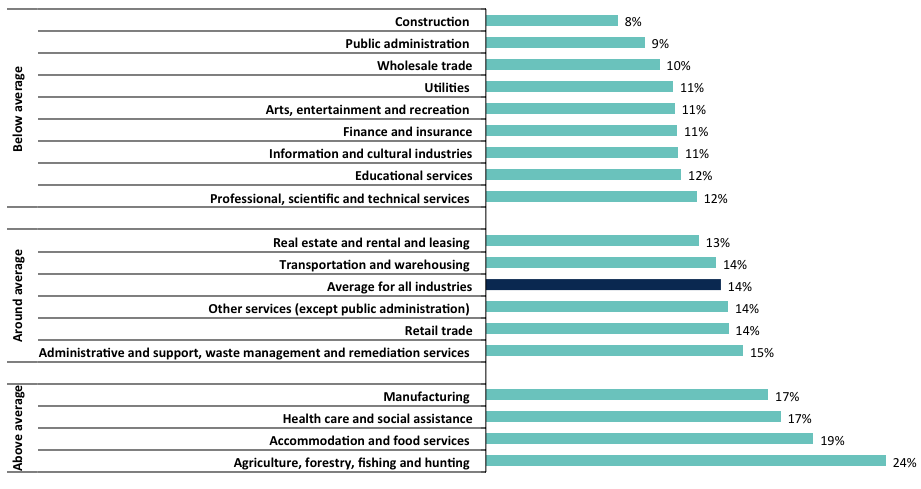
Data source: Statistics Canada, National Household Survey (2011)
Sarah has been involved with the Hamilton Community Foundation since 2007. She has a long track record of community service and is passionate about giving back and has provided volunteer leadership to a number of local charities, service clubs and philanthropic organizations.
Sarah brings to her role extensive experience as lead Portfolio Manager, Senior Wealth Advisor and head of The Murphy Investment Group at CIBC Wood Gundy. With over 20 years of experience, Sarah values educating and empowering her clients, which include individuals, multi-generational families, charities and large institutions. Sarah was chosen as one of Canada’s Top Wealth Advisors: Best in Province by The Globe and Mail and Shook Research.
FINAL REPORTS for 2021-22 grants from the Edith H. Turner Foundation Fund are due DECEMBER 1, 2023. A link to the report form has been emailed to all grantees. If you did not receive this link, please contact Tami Henderson at 905.523.5600 x 241, or t.henderson@hamiltoncommunityfoundation.ca
We are no longer able to accept final reports via email. Your final report MUST be submitted through the online portal. To access this form, you will first need to log into your HCF online account through the portal. The final report form can be found under the ‘Requirements’ tab.
A troubleshooting guide can be found here.
Amy Montour is a member of the Six Nations of the Grand River community and brings Two-Eyed Seeing to her role, incorporating her knowledge as an Indigenous person and Western-trained physician to Hamilton Community Foundation’s work.
Amy is currently co-lead for the Division of Indigenous Medicine in the Brant Community Healthcare System and a palliative care physician servicing Six Nations of the Grand River Territory and Haldimand County. Her work focuses on improving the experience of Indigenous people accessing health systems and includes advocacy, education, clinical practice and system innovation.
Cheryl Jensen is the retired president of Algonquin College and also had a long career at Mohawk College, where she held the title of Vice President, Academic. Cheryl first joined Mohawk as a Chemical Engineering Technology professor in 1983 and served as Dean, Executive Dean, and Vice President of Engineering Technology, Apprenticeship and Corporate Training.
Cheryl has served on numerous boards related to education, entrepreneurship, and philanthropy. She is known for her organizational and community leadership which has been recognized with numerous awards in Hamilton, Ottawa and nationally through the Association of Canadian Community Colleges.
Charles’ governance experience spans five decades. He has chaired many organizations including Sons of Italy (Hamilton & National), Burlington Community Foundation, Villa Italia Retirement Complex, Art Gallery of Hamilton, Hamilton Health Sciences, The Sicilian Cultural Society of Hamilton. Charles was a lawyer from 1985 to 2018 and is now a mediator and arbitrator in commercial law disputes and is also a construction law adjudicator.
Charles has received several awards including Italian Canadian Citizen of the Year (2010), Festitalia Heritage Award (2015), CIBPA Professional Excellence Award (2018) and Sicilian Ambassador (2022).
Cam Beatty is an accounting and finance professional who is accustomed to advising businesses and not-for-profit organizations, and provides his input and support to HCF through this lens, and with a keen interest in the short- and long-term well-being of the Hamilton community.
Cam has been a Partner of Durward Jones Barkwell & Company LLP (DJB) since 2007 and is the current chair of its executive committee. In this role, Cam helps to set and shape the firm’s strategic direction as well as serving clients in a variety of industries.
Shylo Elmayan has over 15 years of experience working in Indigenous community relations. She is currently the Owner and Lead of Niibin Advisory Services, an Indigenous consulting firm specializing in policy development and community engagement. She was recently the Director of Indigenous Student Services at McMaster University and was responsible for leading a department that supports all aspects of the student experience and success of McMaster’s Indigenous. She had worked previously at McMaster to develop and administer the university’s employment equity census.
Prior joining McMaster, Shylo was a Senior Project Manager with the City of Hamilton and led the development of Hamilton’s first urban Indigenous strategy. Shylo previously worked at Hydro One Networks progressing to Senior Manager, First Nations and Métis Relations. Other previous employment include policy advisor with the Ontario Ministry of Aboriginal Affairs and tenant rights advocate with Aboriginal Legal Services.
Shylo is Anishinaabe and lives in Caledonia. She is a member of the Long Lake #58 First Nation and her family’s traditional territory is located near Hornepayne, Ontario. She has a Bachelor’s degree in First Nations Studies and Political Science from the University of British Columbia and Master’s degree in Public Policy and Administration from Toronto Metropolitan University.
Sandra Edrupt is retired from her role as General Manager Strategy & Business Planning at ArcelorMittal Dofasco and has worked in a variety of management roles in strategy, marketing, quality systems, communications and public affairs, corporate planning and sales.
Sandra is an involved member of the community with extensive governance and other volunteer senior leadership experience with numerous organizations in health care, education, the arts and philanthropy. Recognition for Sandra’s leadership includes distinguished service awards from both the McMaster Alumni Association and McMaster Association of Part-Time Students.
Pranav Pandya is a financial executive with over 20 years of private market and impact investment experience. He is a Principal at Black Hills Advisory Group, providing investment advisory services to institutional investors. Prior to this role, Pranav was the Chief Operating Officer and Chief Financial Officer at a Toronto-based private equity firm specializing in renewable energy, infrastructure, growth equity, and real estate. Pranav is a member of the Chartered Professional Accountants of Ontario.
Haider Saeed is a family physician with the Hamilton Family Health Team and the Shelter Health Network. His broad scope of practice brings him in contact with a wide variety of patients, giving him a window into the challenges and stressors they face.
As a medical editor, Haider has a strong understanding of evidence-based medicine and using data to make decisions. He has a long-term interest in urban geography and advocates for people to live healthier lives within cities.
Elizabeth Gray (Mi’kmaw) was born in New Brunswick and has been an active member of the Hamilton Urban Indigenous Community for over 30 years. She brings over a decade of non-profit board experience to HCF, including serving as a director with Dundas Valley Non-Profit Housing, Sacajawea Non-Profit Housing and De dwa da dehs nye>s Hamilton Aboriginal Health Centre.
Elizabeth holds a BA (McMaster), Master of Social Work (Laurier), an Indigenous Educators Certificate in Indigegogy (Laurier) and a Certificate in Reconciliation, Conflict Prevention and the Promotion of more Inclusive Societies (McGill).
Elizabeth is currently the Indigenous Counsellor for Mohawk College and also volunteers as an advisor for Centre for Community Engaged Narrative Arts, Body Brave, a National Indigenous Advisory Committee for GBV in the Media and the Hamilton Indigenous Consultation Circle. Elizabeth has been named one of Laurier’s Inspiring Indigenous Alumni.
Assad is an award-winning senior leadership professional with over two decades of experience in the architectural, engineering and construction industry. After more than a decade of working in private sector, Assad has held senior positions with the Niagara Parks Commission, Town of Lincoln, Hamilton Public Library and Conservation Halton. As a leader in sustainable projects, Assad loves to create innovative, inclusive, and inspiring places and spaces. As an HCF director, Assad draws from his individual area of expertise in strategic and capital planning to provide sound lived advice.
| CityHousing Hamilton (Sponsor: City of Hamilton) | $21,200 |
| De dwa da dehs nye>s Aboriginal Health Centre | $25,000 |
| Elizabeth Fry Society | $5,000 |
| Essential Aid and Family Services of Ontario Inc. | $10,000 |
| Good Shepherd Centres Hamilton | $25,000 |
| Hamilton Community Legal Clinic | $10,000 |
| Hamilton Downtown Mosque | $20,000 |
| Hamilton East Kiwanis Boys' and Girls' Club | $8,800 |
| Hamilton Foodshare | $20,000 |
| Hamilton Regional Indian Centre | $20,000 |
| HamSMaRT (Hamilton Social Medicine Response Team) (Sponsor: The AIDS Network) | $10,000 |
| Living Rock Ministries | $20,000 |
| Mission Services of Hamilton | $25,000 |
| Muslim Association of Hamilton | $15,000 |
| Neighbour to Neighbour Centre (Hamilton) | $20,000 |
| Refuge (Sponsor: Empowerment Squared) | $15,000 |
| Shelter Health Network (Sponsor: Good Shepherd Centres Hamilton) | $10,000 |
| St. Matthew's House | $10,000 |
| The Salvation Army Hamilton Booth Centre | $25,000 |
| Welcome Inn Community Centre of Hamilton | $15,000 |
| Wesley Urban Ministries | $25,000 |
| YWCA Hamilton | $25,000 |
| Body Brave | Support to meet needs of Hamilton clients unable to access usual hospital supports at this time | $10,500 |
| Big Brothers Big Sisters of Halton Hamilton | Supports staff coverage and volunteer training for program to identify and connect with highly vulnerable children in their programs for weekly well-being check-in and encouragement/engagement | $15,000 |
| Cancer Assistance Program | Support delivery of essentials to clients | $7,500 |
| Catholic Children's Aid Society of Hamilton | Food security for kinship families and children in care, and basic needs for youth aging out of care | $16,000 |
| City Housing Hamilton | Food support for highly vulnerable populations, and support for personal hygiene products | $5,300 |
| Dr. Bob Kemp Hospice | Support PPE and ipads for patients to stay connected to families | $10,000 |
| Elizabeth Fry Society Southern Ontario Region | Essential hygiene, food and childcare needs | $5,000 |
| Elliott Heights Baptist Church | Food support for vulnerable children and families in the Larch After School Program | $5,000 |
| Elliot Heights Baptist Church | Maintain and expand Larch After School program during COVID-19 | $10,000 |
| Empowerment Squared | Support to help newcomer families access government assistance and other resources | $25,000 |
| Eva Rothwell Centre | Food security | $4,000 |
| Good Shepherd Centres | Support for most-needed items including food, diapers, hygiene products, and technology to engage with clients | $25,000 |
| Grenfell Ministries/Welcome Inn Community Centre of Hamilton | Purchase of basic needs and harm reduction supplies for vulnerable people and Overdose Prevention Line and small grants for people just released from corrections | $3,500 |
| Hamilton Centre for Civic Inclusion | Support to Caremongering program, food security prioritizing racialized and disabled people | $15,000 |
| Hamilton Habitat for Humanity | Provide free home repairs for vulnerable homeowners living in unsafe conditions | $10,000 |
| Hamilton Jewish Federation | Food security | $5,000 |
| Hamilton Foundation for Student Success | Support for equitable access to learning in the Hamilton-Wentworth District School Board | $50,000 |
| Hamilton Wentworth Catholic District School Board | Support for equitable access to learning | $30,000 |
| HAMSMaRT/Keeping Six | Support outreach coordinator and peer support worker roles and provide essential supplies for clients | $20,000 |
| Immigrants Working Centre | Technology and computer literacy support for newcomer individuals and families | $7,020 |
| Institute for Advancements in Mental Health | Support to meet needs of Hamilton clients unable to access usual hospital supports at this time | $10,000 |
| Interval House of Hamilton | Support enabling existing staff to focus on COVID-19 related issues and tasks | $4,120 |
| Interval House of Hamilton | Support initiatives to keep women experiencing intimate partner violence safe, connected and comfortable during the pandemic | $6,650 |
| Islamic Relief- IR Canada | Culturally appropriate basic necessities for newcomers/refugees, people with low income and seniors | $15,000 |
| L'Arche Hamilton | Technology to administer proper care remotely, and to prepare isolation spaces | $15,000 |
| Learning Disabilities Association of Halton | Provide supports not covered elsewhere for Hamilton students with learning disabilities and exceptionalities | $5,324 |
| Liberty For Youth | Support ability to provide mentorship, mental health and other services online, and to provide basic needs and other support for vulnerable youth affected by pandemic | $20,000 |
| Micah House Refugee Reception Services Inc. | Support basic needs of tenants in shelter | $5,000 |
| Mohawk College | Purchase basic needs items for packages for international students/families in financial need | $25,000 |
| Neighbour 2 Neighbour Centre | Support food access through gardening for families and individuals living on low-incomes | $14,200 |
| Parkview Church of the Christian and Missionary Alliance | Purchase essential items for food boxes for people in need | $15,000 |
| Refuge: Hamilton Centre for Newcomer Health/Empowerment Squared | Support translation services for Refuge clients | $15,000 |
| Second Harvest Food Support Committee | Expand foodrescue.ca platform to Hamilton, to facilitate donation of surplus food from businesses to social service organizations | $15,000 |
| Sex Workers' Action Program of Hamilton/Hamilton AIDS Network | Support for emergency food, housing, transportation, hygiene items and other small grants related needs arising from COVID-19 | $5,000 |
| Shalom Village | Support staff costs for resident care related to COVID-19 | $24,000 |
| Spinal Cord Injury Ontario | Offset administrative costs related to online platforms for staff, clients, family and caregivers | $6,000 |
| St. Joseph’s Healthcare Foundation | Support Mobile Nursing Clinic to assist outpatients managing mental illness | $50,000 |
| Victorian Order of Nurses - Hamilton | Maintain services and connection to clients and caregivers while day and respite care services are closed | $5,000 |
| Welcome Inn Community Centre | Support to maintain services to multiple vulnerable populations normally supported by thrift store revenues | $25,000 |
| Wellwood Resource Centre | Continuation and expansion of transition to virtual programming, online self-help resources and online peer-mentoring | $10,000 |
| Wesley Urban Ministries | Provide hot meals to vulnerable people in Hamilton | $15,000 |
| YMCA of Hamilton/Burlington/Brantford | Basic needs of tenants in transitional housing | $25,000 |
| Total | $609,114 |
| Afro Canadian Caribbean Association | Offset revenue loss and buying PPE, sanitation supplies and dividers. | $20,000 |
| Afro Canadian Caribbean Association | Create a virtual program where seniors can connect and provide culturally-centred mental health supports | $30,000 |
| Alzheimer Society | Reconfiguring space, cleaning supplies and costs to continue online and in-person programming | $12,300 |
| Ancaster Community Services | Partial recovery of revenue lost from cancelled fundraisers, purchase of PPE, program costs, purchase of a new staff laptop. | $15,000 |
| Big Brothers Big Sisters | PPE, staffing, equipment and covering youth activitiy fees for in-person physical and social program for youth | $15,158 |
| Body Brave | Curriculum development and knowledge translation. | $10,000 |
| City Kidz Ministry | Buying PPE, wages for program delivery, program materials and staff training. | $10,000 |
| Culture for Kids in the Arts | Move resonance choir for children and youth with disabilities online | $15,000 |
| Dundas Valley School of Art | Program equipment and equipment for staff to work remotely. | $10,000 |
| Dundas Valley School of Art | Supplies for online art therapy for frontline workers | $17,100 |
| Dundas Youth Chaplaincy | Offsets revenue loss to allow for continuation of programming. | $10,000 |
| Elliot Heights Baptist Church | Offsets revenue loss to allow for continuation of child/youth programming. | $10,000 |
| Empowerment Squared | Offsets revenue loss to allow an Educational Program Coordinator for racialized newcomer youth to continue. | $10,000 |
| Essential Aid & Family Services of Ontario | Offsets revenue loss to allow for providing essential needs. | $10,000 |
| Friends of the Aviary | Offsets revenue loss to allow vet visits and buying bird food. | $8,000 |
| Hamilton Artists Inc. | Supports efforts to further engage BIPOC artists in an effective way during and post-pandemic. Also supports BIPOC-focused professional development for staff. | $8,000 |
| Hamilton Children's Choir | Online programming and social distancing practices in-person. | $10,000 |
| Hamilton Conservatory for the Arts | To develop new forms of program delivery in the context of the pandemic. | $3,000 |
| Hamilton Jewish Federation | Food, hygiene supplies and transportation expenses related to winter essential kits and kosher food bank support | $11,500 |
| Hamilton Naturalists' Club | Supports GO Explore outdoor education program in schools. | $9,000 |
| Hamilton Philharmonic Orchestra | Moving performances online. | $15,000 |
| Hamilton Theatre Inc | Supports replacement of revenue loss. | $10,000 |
| Hamilton Youth Steel Orchestra | Space rental and equipment for virtual performances. | $20,000 |
| Living Rock Ministries | Supports replacement of revenue loss and buying safety supplies and equipment. | $15,000 |
| Micah House | Materials related to settlement program for new refugees | $18,844 |
| Mohawk College Foundation | Address food security issues related to COVID-19 for Mohawk College Indigenous students/households | $20,000 |
| Native Women's Centre | Supports board members' ability to connect remotely during the pandemic. | $9,081 |
| Neighbour 2 Neighbour | Offsets revenue loss used to fund the emergency food program. | $10,000 |
| Parkview Church of the Christian and Missionary Alliance | Supports replacement of revenue loss. | $10,000 |
| Portugese Community Support | Online programming and preparing physical space and PPE for socially-distanced programing for adults and families with disabilities | $8,517 |
| Refuge (Sponsor: Empowerment Squared) | Outreach worker and program supplies to support mental health of racialized youth | $30,000 |
| Salvation Army | Mobile unit and PPE to allow women on conditional release to safely visit with social supports during pandemic | $14,000 |
| Social Planning & Research Council of Hamilton | Retrofitting of office space. | $2,000 |
| Somali Community in Hamilton | Online programming and safe reopening of offices. | $10,000 |
| Somali Community in Hamilton (Sponsor: Afro Canadian Caribbean Association) | Educational and other resources to reduce and prevent negative health outcomes | $25,000 |
| St. Matthew's House | Moving fundraising online. | $10,000 |
| Student Open Circles | Supports replacement of lost revenue and moving services online. | $14,000 |
| Suicide Prevention Community Council of Hamilton | Supports replacement of revenue loss. | $7,500 |
| The Baby Depot | Rental of additional space in order to serve more families, and buying PPE. | $17,000 |
| The Equestrian Association for the Disabled (T.E.A.D.) | Supports replacement of revenue loss. | $10,000 |
| The SPACE Youth Centre | Safe reopening of offices. | $10,000 |
| Tottering Biped Theatre | Supports replacement of revenue loss | $10,000 |
| Welcome Inn Community Centre | Funding for adapting volunteer supports. | $10,000 |
| Total | $550,000 |
| De dwa da dehs nye>s Aboriginal Health Centre | Indigenous Community Event and Vaccine Education | $28,000 |
| Hamilton Social Medical Response Team (HAMSMaRT) | Expand peer-based harm reduction work in serving street-entrenched and drug user populations | $77,450 |
| The John Howard Society | Cleaning and equipment costs | $25,000 |
| Niwasa Kendaaswin Teg | Poverty reduction worker providing culturally relevant wrap around supports | $62,000 |
| Social Planning and Research Council (SPRC) | Financial empowerment program supporting Hamiltonian’s access to financial benefits to which they are entitled | $75,000 |
| Total | $267,450 |
| A Rocha Canada | Supporting grant | $15,000 |
| ACORN Institute Canada | Helping tenants access their housing rights during COVID-19 | $15,000 |
| Afro-Canadian Caribbean Association | Black Community Wellness Project: providing culturally appropriate mental health services | $46,250 |
| Amity Goodwill Industries | Pandemic community meal relief in support of De Mazanod Door outreach program | $44,850 |
| Art Gallery of Hamilton | Learn - Artist-led projects for children in Grades K-5 | $20,000 |
| Big Brothers Big Sisters of Halton and Hamilton | Systems navigation support for wraparound services | $30,000 |
| Body Brave | Urgent treatment and support for women struggling with COVID-19-triggered mental illness | $20,000 |
| Brott Music Festival | Brott In The Park: Socially distanced concert series | $10,000 |
| Cancer Assistance Program | Supporting drive & ride van program | $15,000 |
| Carnegie Gallery | Programming, equipment upgrade and operating assistance | $12,500 |
| Catholic Youth Organization | Camperships and equipment to allow for social distancing | $27,600 |
| Centre[3] for Print and Media Arts | Arts-based modules for isolated seniors | $15,000 |
| City Housing Hamilton | Prepared meals for seniors | $9,000 |
| Compass Community Health | Pathways Hamilton summer food security and social work services | $56,000 |
| Culture for Kids in the Arts | Support for virtual programming | $16,650 |
| Dr. Bob Kemp Hospice | Advancing health care directives, grieving during COVID-19, equipment and trauma bereavement supports | $30,000 |
| Dundas Valley Orchestra | –Support for providing outdoor, distanced rehearsals and concerts | $6,980 |
| Dundas Valley School of Art | Support for fund development staff | $20,000 |
| Eagles Nest Association of Waterdown | Mental health therapy for children and youth | $10,000 |
| Elizabeth Fry Society Southern Ontario Region | Supporting grant | $10,000 |
| Elliot Heights Baptist Church | LARCH after-school program - hot meal delivery and re-integration supports | $20,000 |
| Factory Media Centre | Digital collaboration software and web design for artists | $5,000 |
| Filipinas of HamOnt (Sponsor: Hamilton Centre for Civic Inclusion) | Organizing Hamilton Asian Alliance | $5,000 |
| Fit Active Beautiful Foundation | FAB Girl and volunteer coach recruitment | $5,000 |
| Flamborough Information & Community Services | Virtual programming to support rural seniors | $15,000 |
| Ghana Association of Hamilton (Sponsor: Church of Pentecost Canada) | Supporting seniors in need through a buddy system | $25,000 |
| Good Shepherd Centres | Individual and group social/recreational activities | $41,500 |
| Grace Anglican Church | Purchase of exterior freezer to store donations | $37,958 |
| Grenfell Ministries | Survival supplies for street-involved individuals | $10,000 |
| Hamilton & District Extend-A-Family | Transitions and program expansion | $15,000 |
| Hamilton Academy of Performing Arts | Subsidizing tickets for low-income households and seniors to attend The Nutcracker ballet in December | $5,000 |
| Hamilton Community Benefits Network | Extended medical, mental health, dental and paid sick days for precarious employees | $40,000 |
| Hamilton Community Legal Clinic/Clinique juridique communautaire de Hamilton | Speakers series - addressing hate crimes | $16,640 |
| Hamilton Community Legal Clinic/Clinique juridique communautaire de Hamilton | Social work supports for mental health consumers | $35,000 |
| Hamilton Downtown Mosque | Food kits for marginalized families | $27,878 |
| Hamilton East Kiwanis Boys and Girls Club | Operational support – grant writer and increased staffing hours | $23,000 |
| Hamilton East Kiwanis Boys and Girls Club | Meal kits for families in need | $16,000 |
| Hamilton Festival Theatre Company | Building box office and outreach capacity | $15,000 |
| Hamilton Filipino Community Centre (Sponsor: Jesus is Live Community Inc.) | Malasakit sa Kapwa: A pandemic response aid and data gathering for house-bound Filipinos in Hamilton | $5,000 |
| Hamilton Habitat for Humanity | Assisting with home repairs for low income individuals/families | $20,000 |
| Hamilton International Baptist Church | Tulong sa Pandemya: An aid response, organizing, and basic data collection project for care worker Filipinas in Hamilton | $5,000 |
| Hamilton Music Collective | Program continuation | $20,000 |
| Hamilton Theatre Inc. | Sound system installation and safety barriers | $10,000 |
| Hamilton Foundation for Student Success | Critical student needs | $100,000 |
| Hamilton Wentworth Catholic District School Board | Critical student needs | $80,000 |
| International Association For Refugees Canada | Providing support to refugee claimants | $13,361 |
| Immigrants Working Centre | Project supports for an Arabic speaking settlement worker | $28,702 |
| Indwell Community Homes | Enhanced support programs in Hamilton | $56,000 |
| Interval House of Hamilton | –Continued support for services of mobile mental health worker | $44,745 |
| Islamic Relief- IR Canada | Barakah Box - addressing food insecurity | $30,000 |
| Jennifer Ashleigh Children's Charity (JACC) | Food and shelter needs for seriously ill children in Hamilton | $5,000 |
| Learning Disabilities Association of Halton | Building capacity and advocacy support | $35,341 |
| Empowerment Squared | Computer lab upgrade | $26,220 |
| Liberty For Youth | Mentoring program | $30,000 |
| Living Rock Ministries | Youth drop-in and outreach | $34,000 |
| Mealshare Aid Foundation | Rebuilding to Help End Youth Hunger in Hamilton inking restaurants and charitable partners | $14,000 |
| Métis Women's Circle | Support for the recovery and mending of pandemic-disrupted relationships | $23,050 |
| Mishka Social Services | Sanad Case Management & Counselling Program | $25,000 |
| Munar Learning Center | Digital devices and IT support | $5,000 |
| Neighbour to Neighbour Centre | Support for coordinators of community gardens during COVID-19 | $7,000 |
| Neighbour to Neighbour Centre | Support to newcomers and persons experiencing ongoing barriers to settlement . | $25,000 |
| Niwasa Kendaaswin Teg | Indigenous support and food security | $50,000 |
| Options for Independent Living and Development | Increased hours for day-program staffing | $10,000 |
| Rainbow's End Community Development Corporation | Employment training for mental health consumers | $24,000 |
| Refuge: Hamilton Centre for Newcomer Health | Support for hiring and training interpreters and cultural facilitators | $20,000 |
| Ronald McDonald House Charities South Central Ontario | Providing food to families | $20,000 |
| Royal Botanical Gardens | Virtual school field trips | $10,000 |
| Second Harvest Canada | Revitalizing food rescue and distribution | $20,000 |
| Sex Workers' Action Program of Hamilton | Harm reduction packages for sex workers | $18,457 |
| Sexual Assault Centre (Hamilton and Area) | Support for victims of sexual assault | $64,480 |
| Shakespearience Performing Arts | Moving programming on-line | $5,500 |
| Shalem Mental Health Foundation | Outdoor, distanced art activities for youth | $17,212 |
| Start2Finish Canada | Mental health supports for families engaged in Start to Finish program | $10,000 |
| The AIDS Network | Food, PPE, and sanitary items | $30,000 |
| The Bridge From Prison to Community | Transitional housing program and wraparound reintegration supports | $15,000 |
| The Canadian National Institute for the Blind | Virtual programming addressing significantly increased isolation during COVID-19 | $15,000 |
| The Equestrian Association for the Disabled (T.E.A.D.) | Operating support for horses and therapeutic riding instructors | $15,000 |
| The Harlequin Singers of Hamilton | Operating support | $2,500 |
| The John Howard Society of Hamilton, Burlington & Area | Emergency release and reintegration services | $54,088 |
| The King's Way Outreach Centre | Supporting grant for operational costs | $25,000 |
| The Learning Partnership | Resources and activities to activate literacy, numeracy and play-based-learning | $13,600 |
| The Westdale Theatre | Family movie weekends | $10,000 |
| Threshold School of Building | Support for job developer position | $25,000 |
| Tottering Biped Theatre | Project adaptations | $20,000 |
| Wayside House of Hamilton | Integrated virtual care and communication program- men with addictions | $16,000 |
| Welcome Inn Community Centre | Food access and community visitation for seniors | $45,000 |
| Wellwood Resource Centre | –Self-care kits for people with cancer | $15,000 |
| YMCA of Hamilton/Burlington/Brantford | Support rent subsidies for residents facing eviction and for employment counselling services | $50,000 |
| YWCA Hamilton | Meals, engagement, & capacity building for transitional living program | $13,500 |
| Total | $2,080,562 |
| De dwa da dehs nye>s Aboriginal Health Centre | $25,000 |
| Elizabeth Fry Society | $5,000 |
| Essential Aid and Family Services of Ontario Inc. | $10,000 |
| Good Shepherd Centres Hamilton | $25,000 |
| Hamilton Community Legal Clinic | $10,000 |
| Hamilton Food Share | $50,000 |
| Hamilton Social Medicine Response Team (HamSMaRT) | $10,000 |
| Living Rock Ministries | $20,000 |
| Mission Services of Hamilton | $25,000 |
| Neighbour to Neighbour Centre (Hamilton) | $20,000 |
| Shelter Health Network | $10,000 |
| St. Matthew’s House | $10,000 |
| The Salvation Army Booth Centre | $25,000 |
| Welcome Inn Community Centre of Hamilton | $10,000 |
| Wesley Urban Ministries | $25,000 |
| YWCA Hamilton | $25,000 |
| Total | $305,000 |
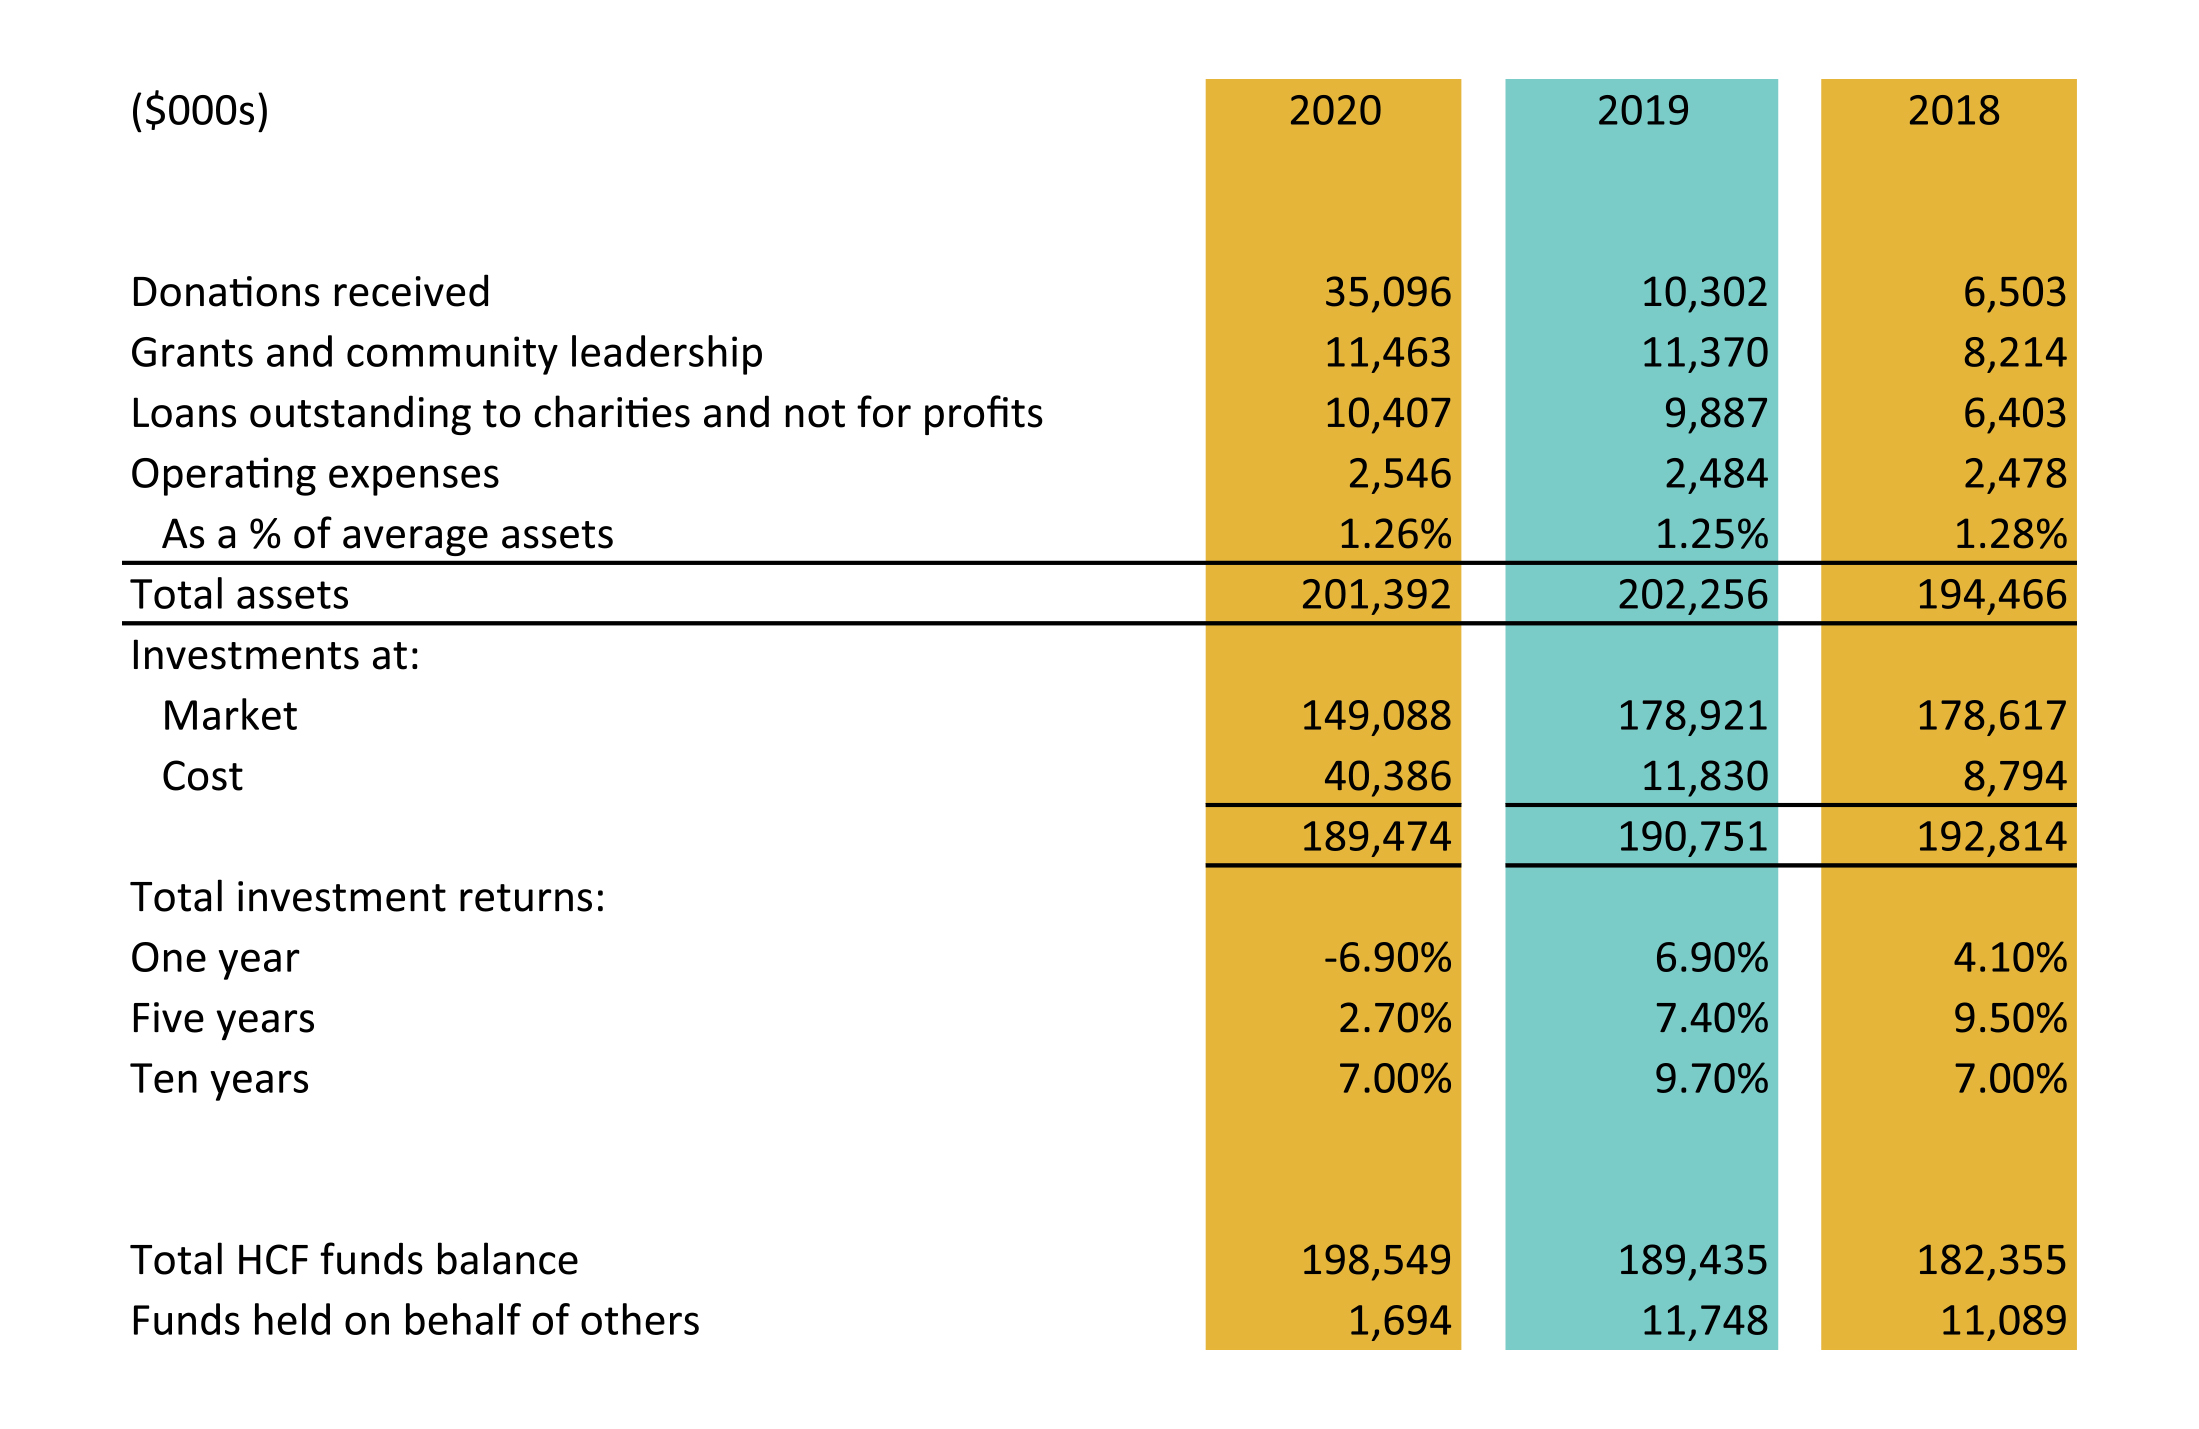
Donations to the Foundation are invested for the long term in public markets and in alternative investments. Investment income is then allocated annually to support granting, community leadership and operations. The summary and charts presented here provide both a financial snapshot and a history of recent activity that underlies the grants and community leadership activities represented in this annual report, made possible by remarkable donors.
Donations to the Foundation are from individuals, corporations and other charities. Donors may contribute to named endowment or flowthrough funds, to the Board-directed Community Fund, or to HCF’s community leadership projects.
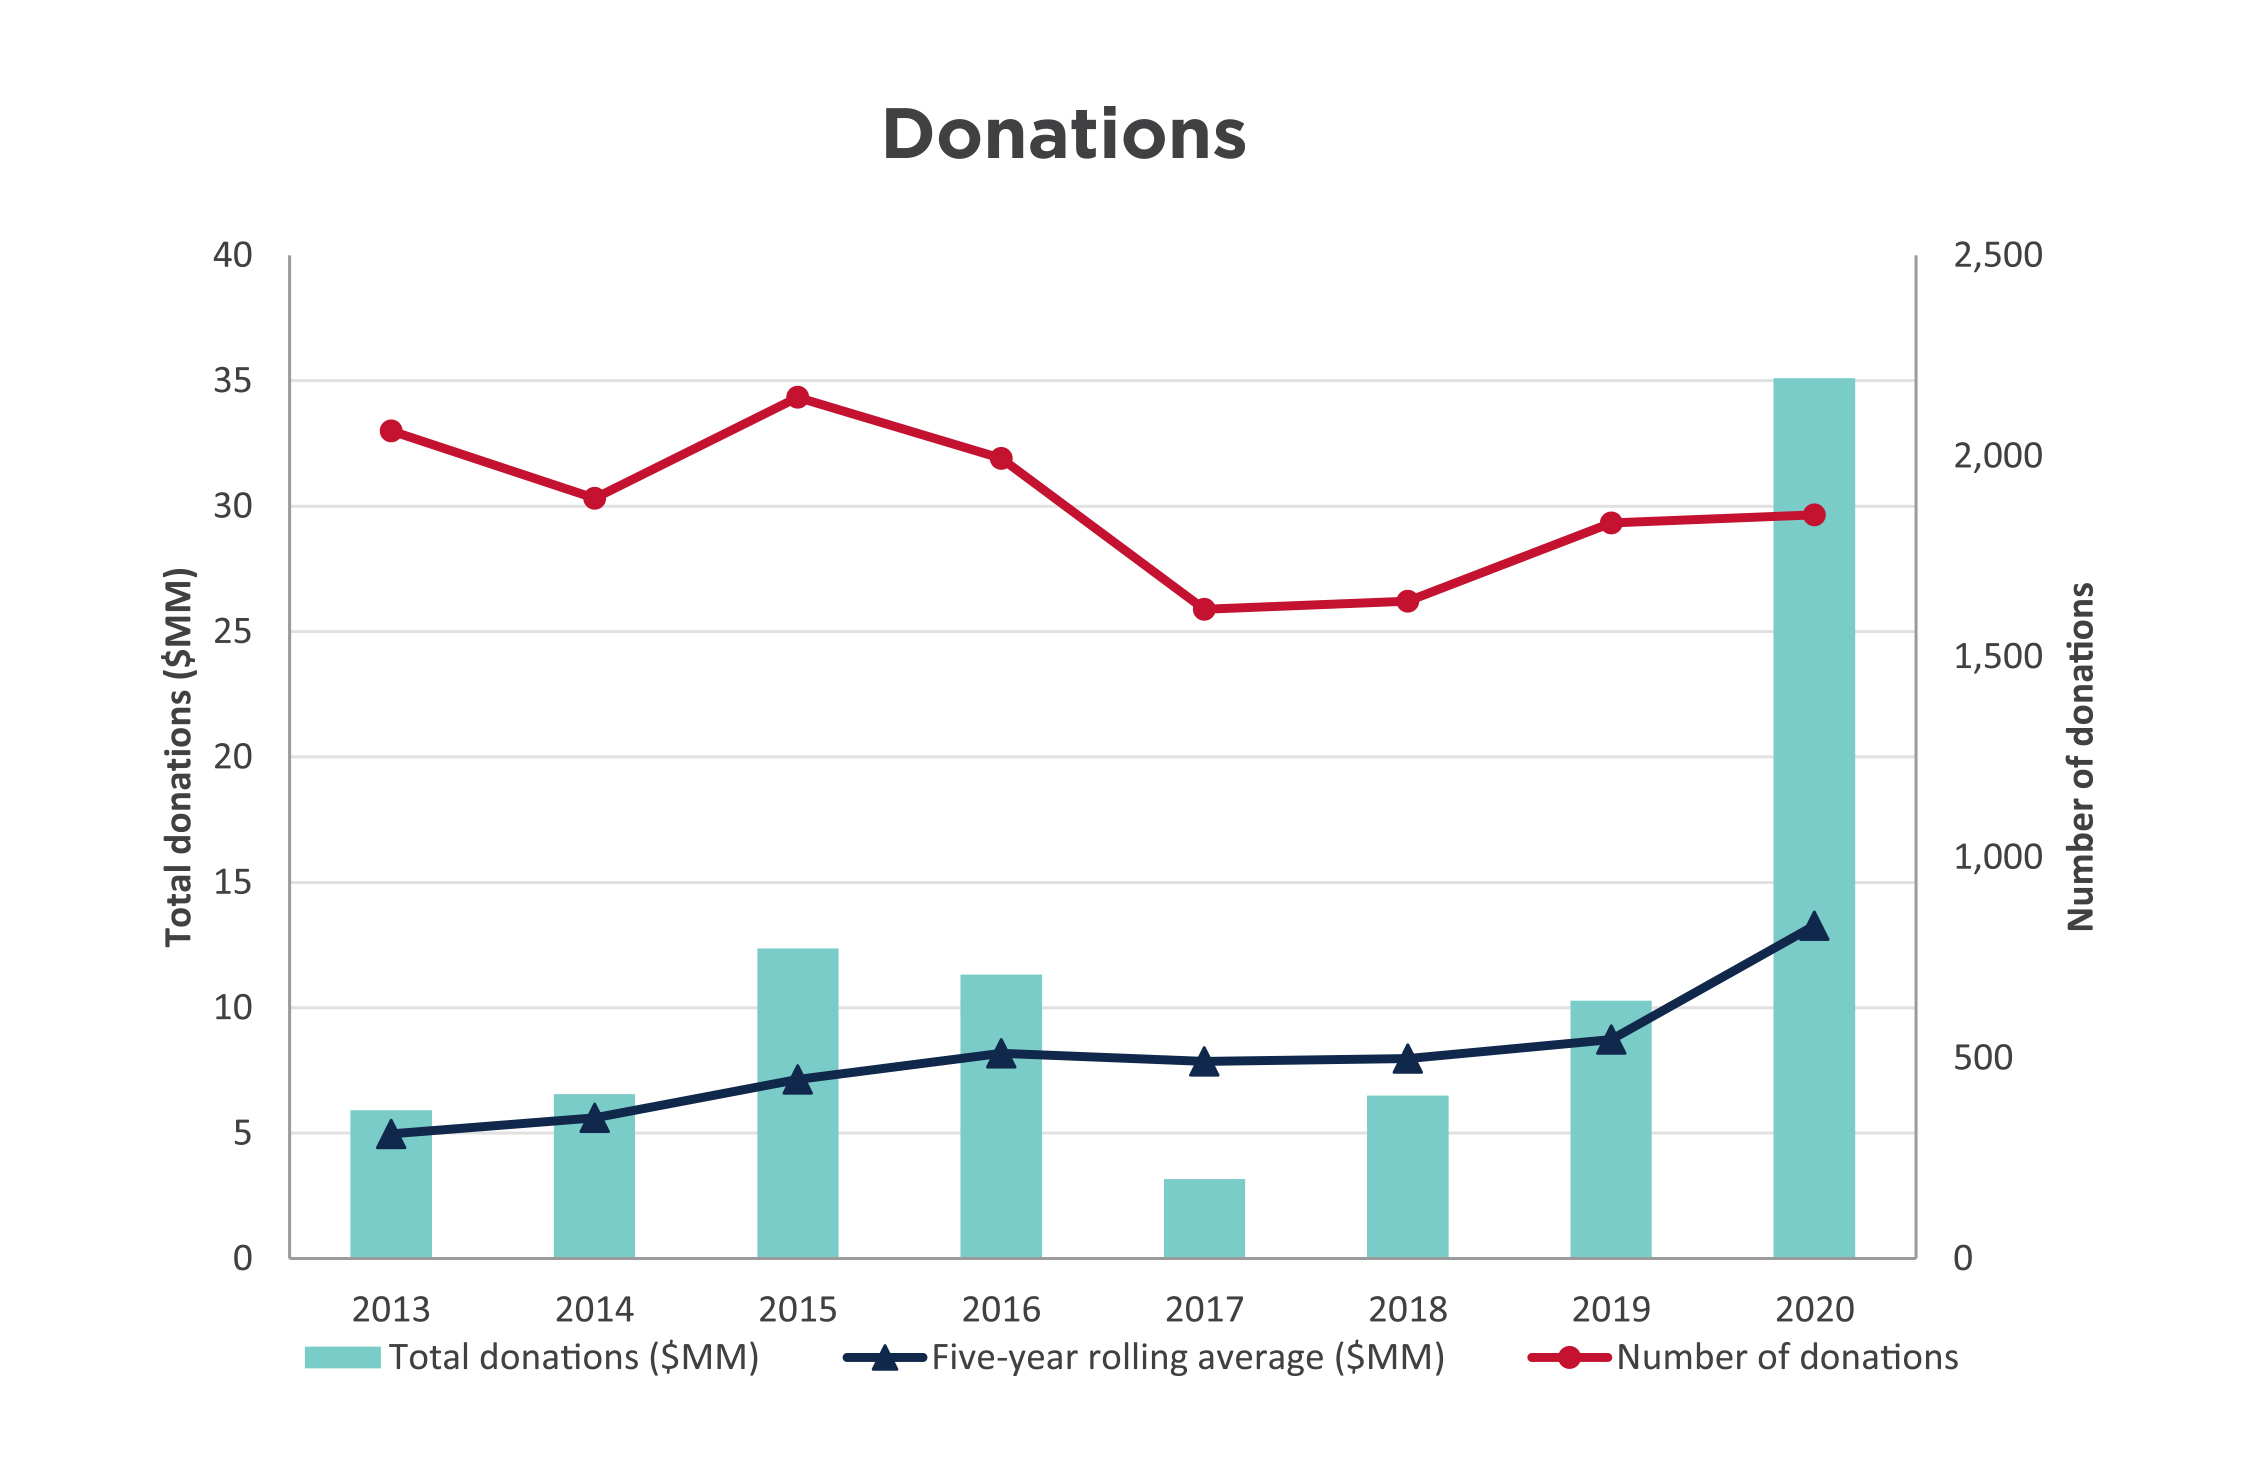
The $35.1 million in donations this year is the second highest total in HCF’s history. Annual donations are influenced by the timing of the realization of donations in wills and significant one-time donations like the $27.7 million in donations of property and private equity. As illustrated in Chart 1, annual donations have ranged between $3.2 and $35.1 million over the past eight years. The five-year rolling average of donations ranges from $5.0 million to $13.3 million over the past eight years.
The five-year rolling average number of donations is 1,787 with 2019-20 at 1,853. The number of donations fluctuates based on “in memoriam” donations and the number and nature of events sponsored by donors to raise money for their funds.
Chart 1
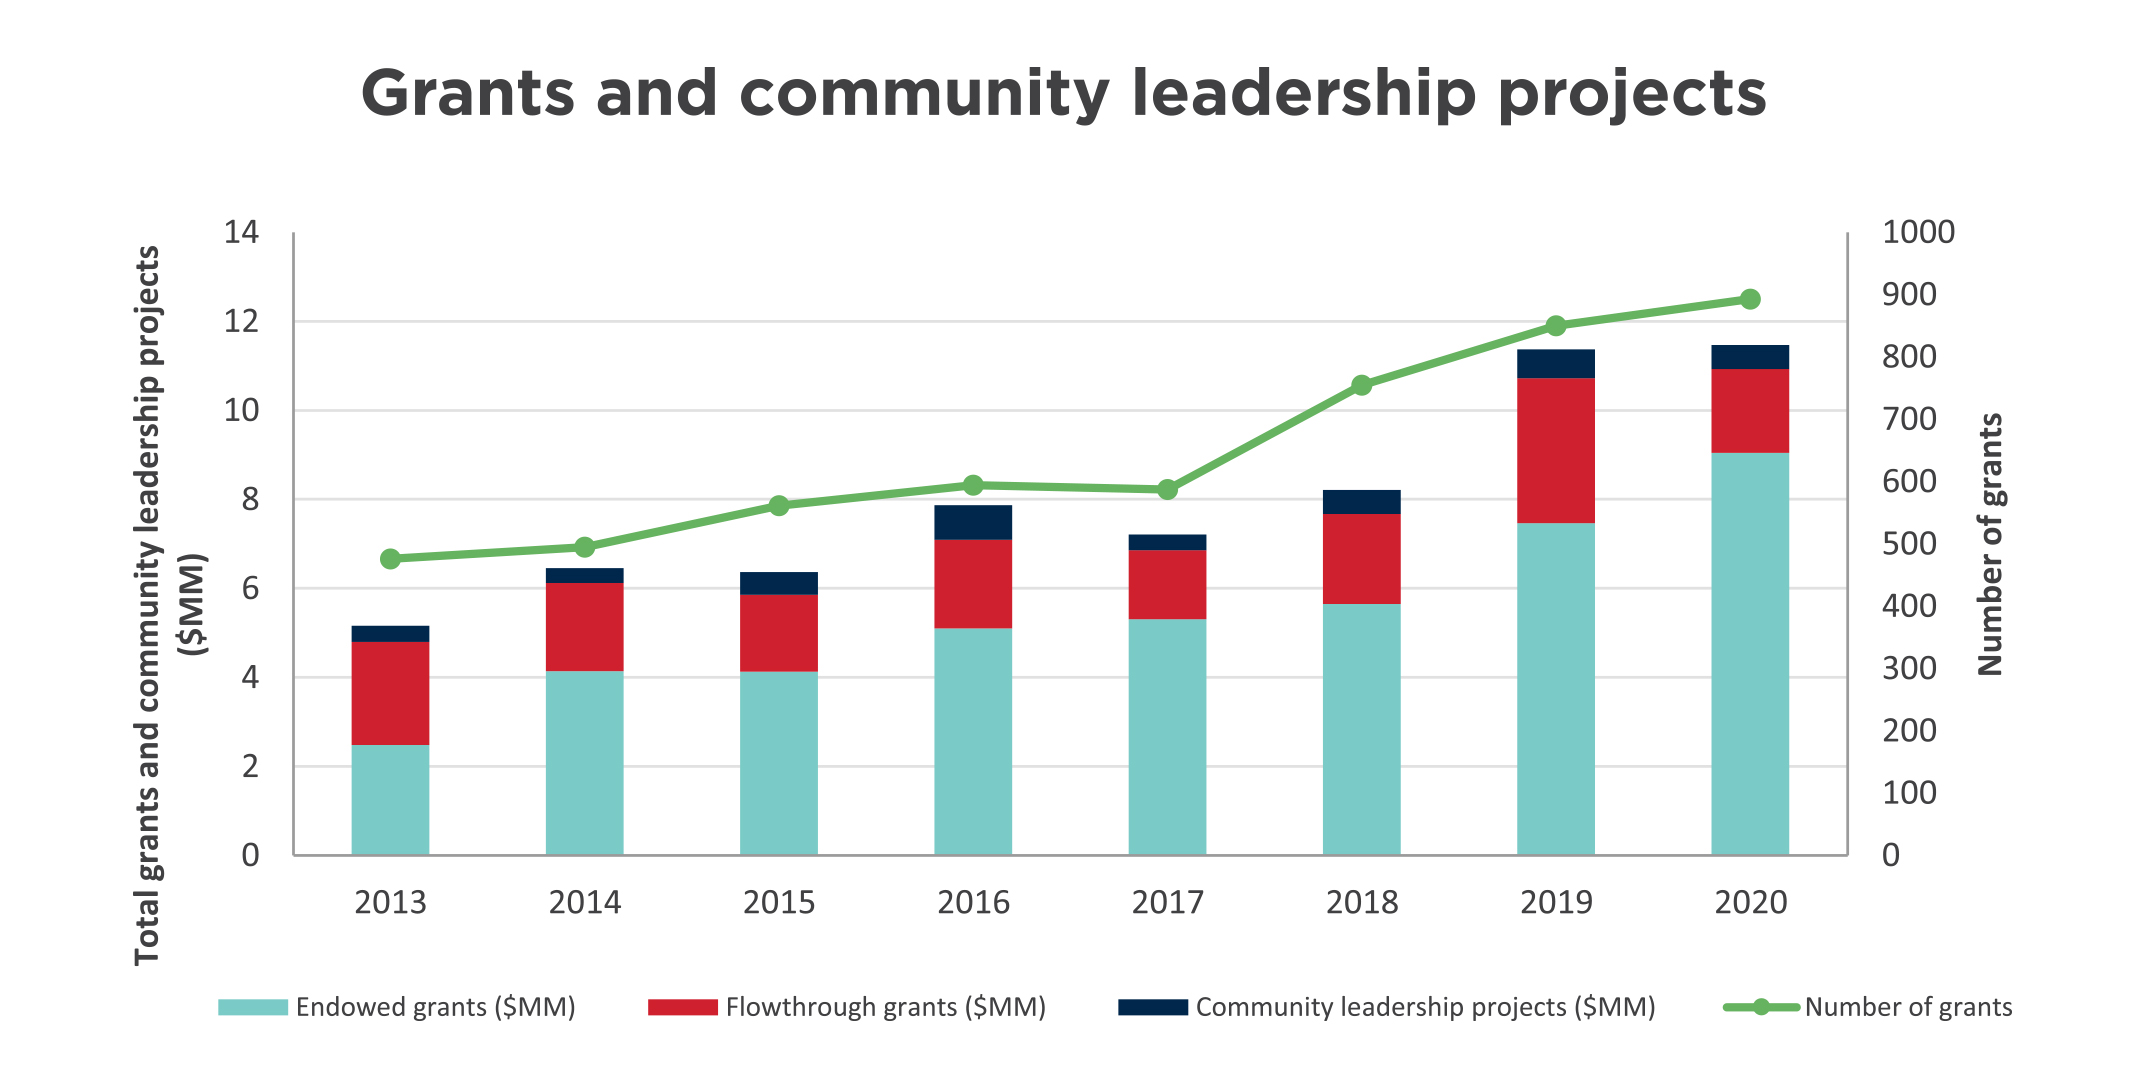
Grants are made annually from both endowed and flowthrough funds. Because flowthrough fund balances are distributed in a shorter time period, granting from these funds can materially influence HCF’s total annual amount granted.
As illustrated in Chart 2, grants and community leadership project spending over the past eight years has ranged from $4.7 million to this year’s historic high of $11.5 million. Granting from endowment funds was reduced in 2013 as a result of the decline in investment returns in 2012 which a) lowered the asset base used for the granting calculation (currently four percent of the fund balances), and b) resulted in less income available to grant. Flowthrough granting and expenditures on community leadership projects has ranged from 22 to 56 percent of total granting in any given year and is dependent on the timing and nature of flowthrough and project activity. At 893, the number of grants for this year is 37 percent higher than the eight-year average.
Chart 2
Investments traded in active markets are reported at fair market value. Investments not actively traded are recorded at their cost less any impairment of their value.
To support our strategy of aligning our assets with our mission and to provide a more diverse and robust portfolio, HCF has committed to investing in alternative asset classes including loans to charities and not-for-profits, private debt, real estate, infrastructure and private equity. These alternatives are consistent with the Foundation’s long-term investment horizon and liquidity requirements. Since these investments are not actively traded, they are valued at cost in the investments. These alternatives total $25.8 million.
HCF invests according to policy guidelines established by the Board of Directors. Two committees of the Board oversee investments to ensure compliance with the policy:
As an endowment builder, HCF’s policy focuses on long-term investing and is supported by reserve accounts that are currently at their policy maximum.
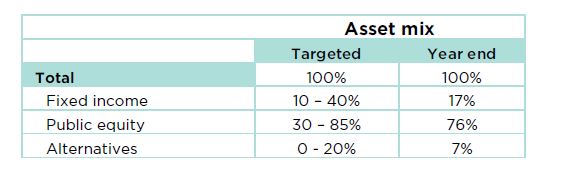
The investment policy sets out a total portfolio target asset mix, as well as a range around these targets. The public market investment managers have mandates within this targeted asset mix and use their discretion to invest the portfolios within this range. Chart 3 reflects the current and target asset mix. Note: $25 million of private equity relates to a fund established by a donor and is not part of the asset mix or the consolidated portfolio results.
Chart 3
Two long-term portfolios are invested in the public markets with Jarislowsky Fraser, and Connor, Clark & Lunn. Chart 4 compares those portfolios against benchmarks as follows:
Benchmarks reflect the performance of each market index based on HCF’s specific target asset mix. Comparing actual results to the benchmark measures the value added by investment managers compared to the average market performance. HCF’s investment policy target is a long-term investment return in the 6.5 to 7.5 percent range.
Chart 4
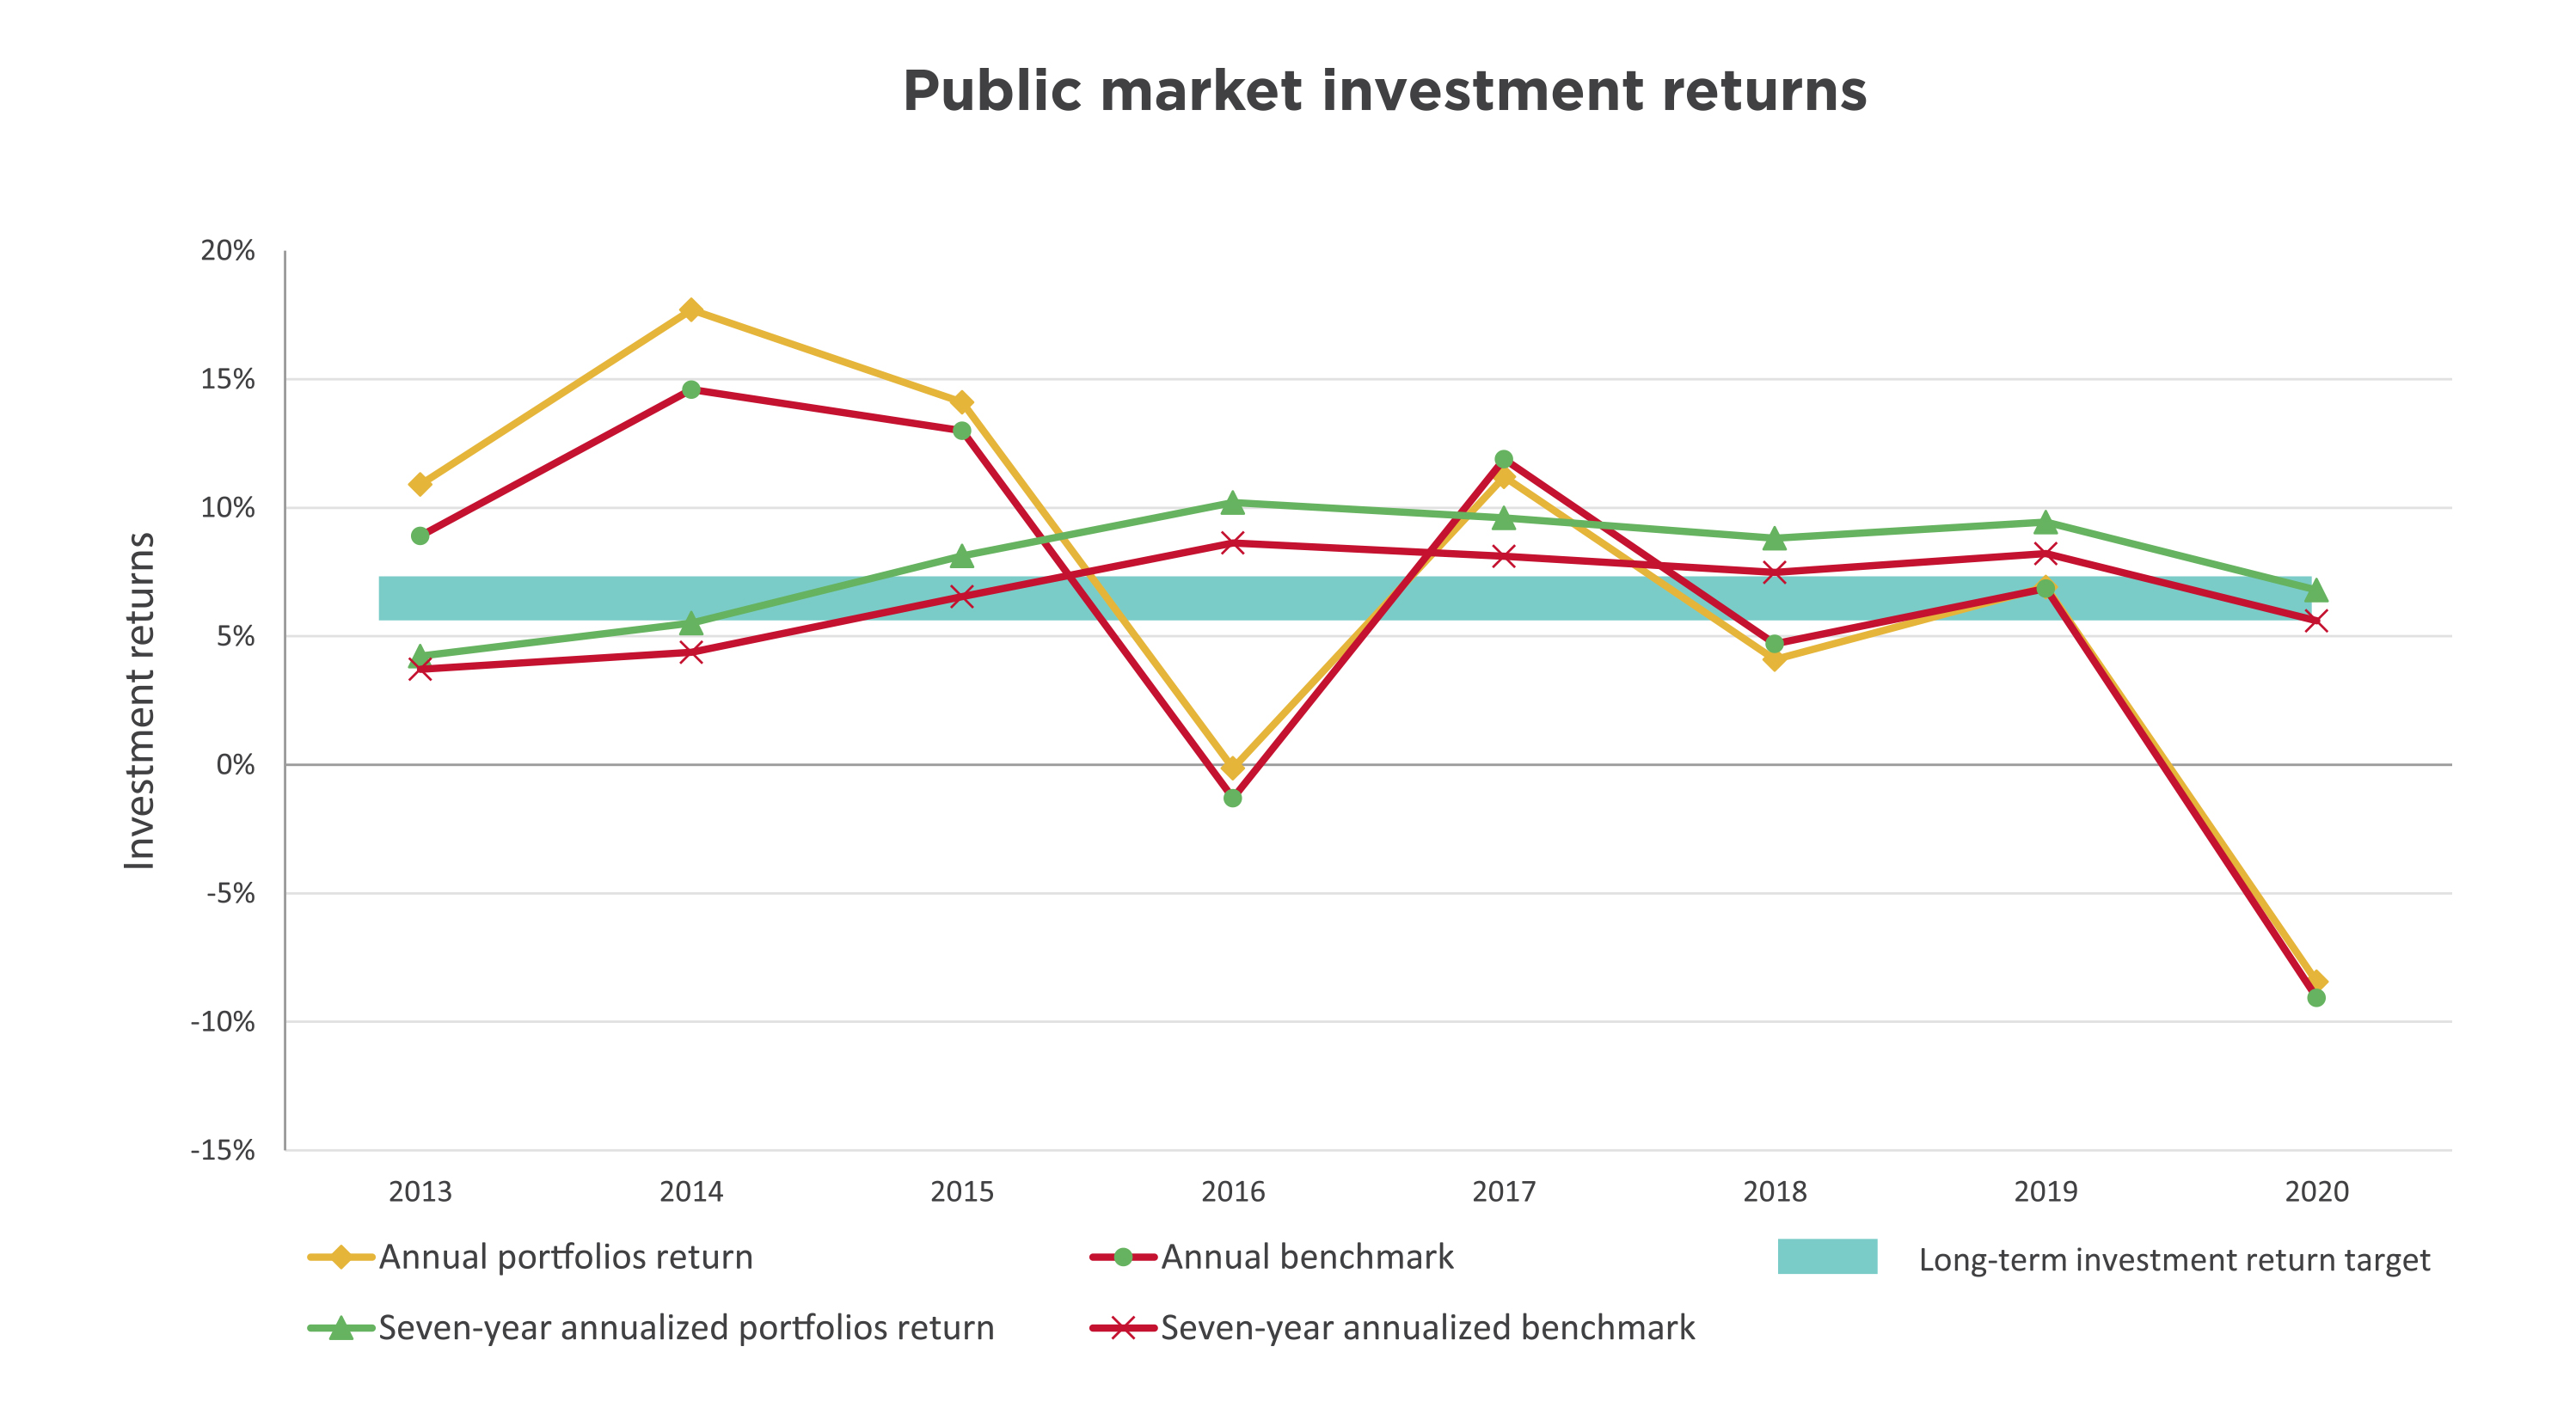
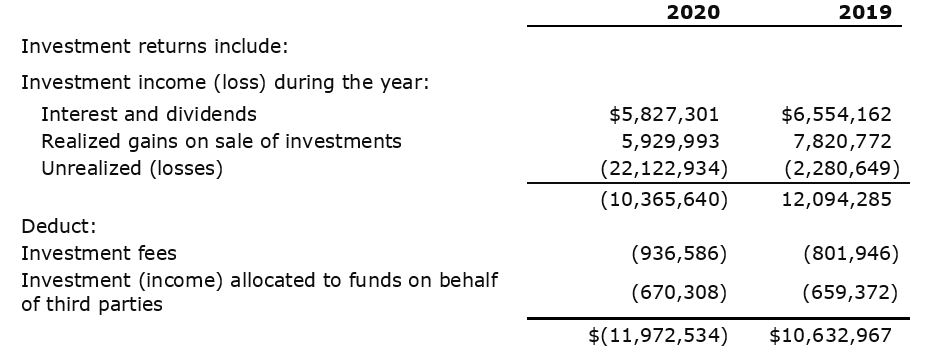
The effect of the global pandemic has materially affected investment returns, resulting in a -8.4 percent public market return for the year. The seven-year annualized return at 6.8 percent is within the targeted investment policy range and is 1.2 percent higher than the 5.6 percent benchmark. As noted in the financial highlights, the current 10-year annualized return of 7.0 percent is in the target range and is higher than the benchmark by 1.2 percent.
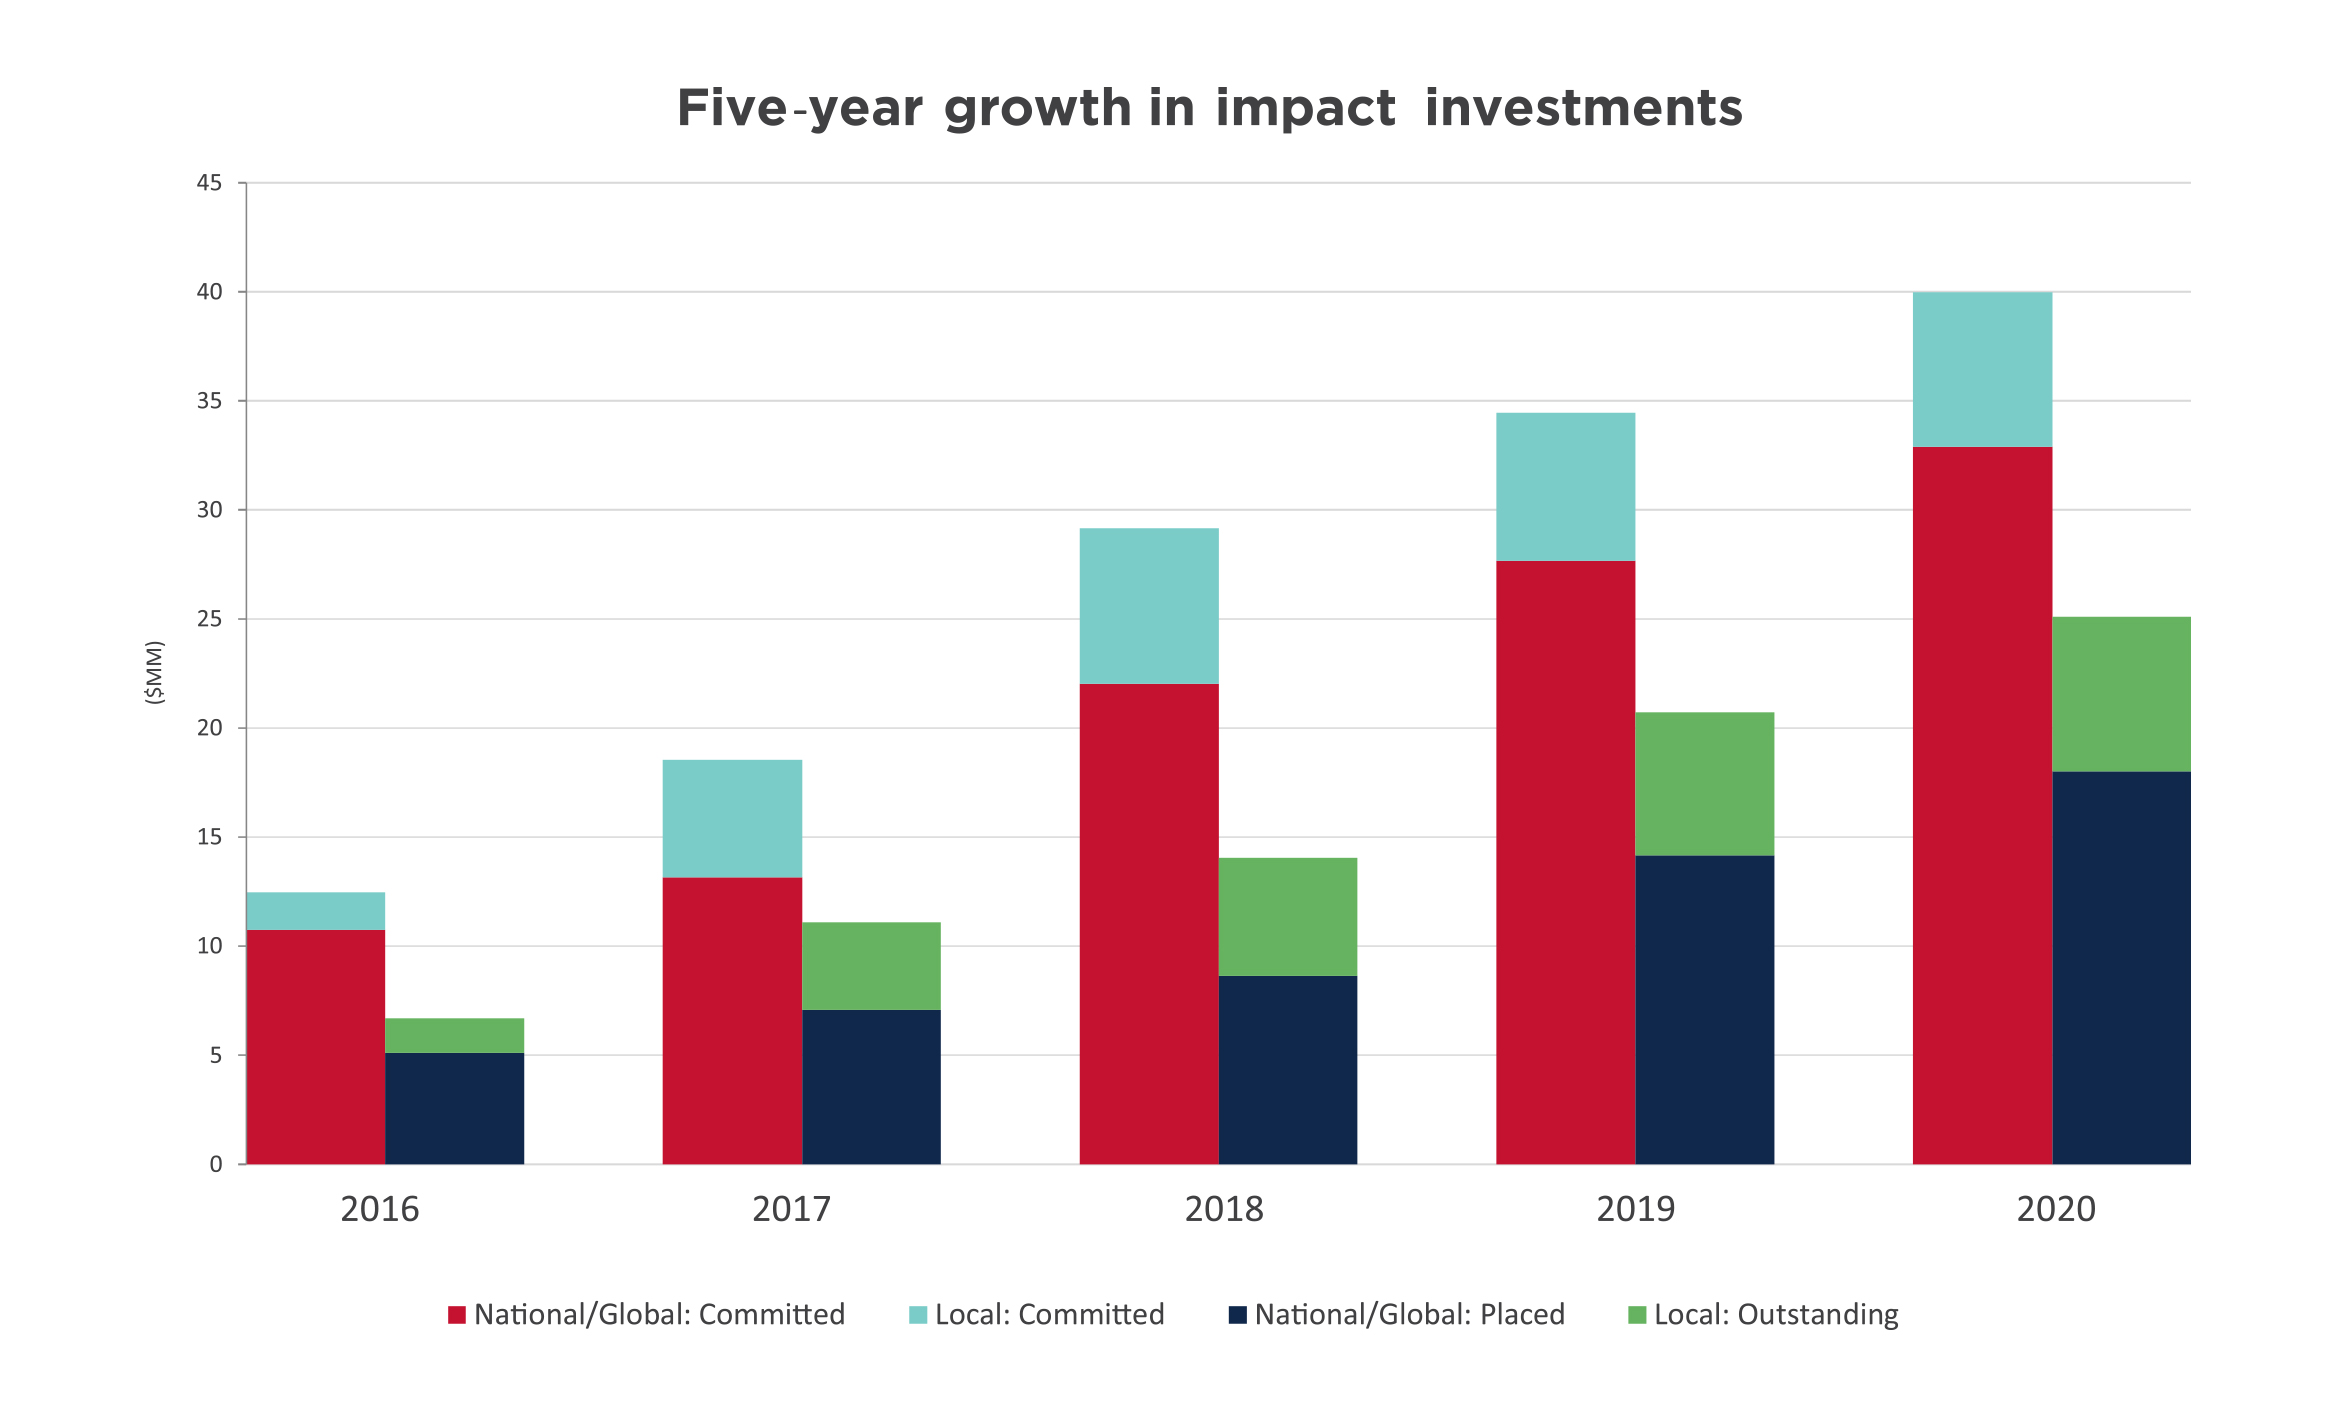
Impact investments enable donations to endowed funds to drive positive change beyond granting, because they represent investments of capital that deliver financial returns coupled with positive social and/or environmental outcomes. In addition, these investments provide a pool uncorrelated to the public markets which, in turn, buffers the portfolio from the volatility currently experienced.
More than 15 percent of our long-term assets are in impact investments. Chart 5 illustrates HCF’s impact investing progress over the past five years, with $25 million currently placed or outstanding and another $15 million committed. This brings the total commitment to $40 million, up from $34 million last year. Impact investments cover areas including affordable housing, arts, environment and sustainable development.
Chart 5
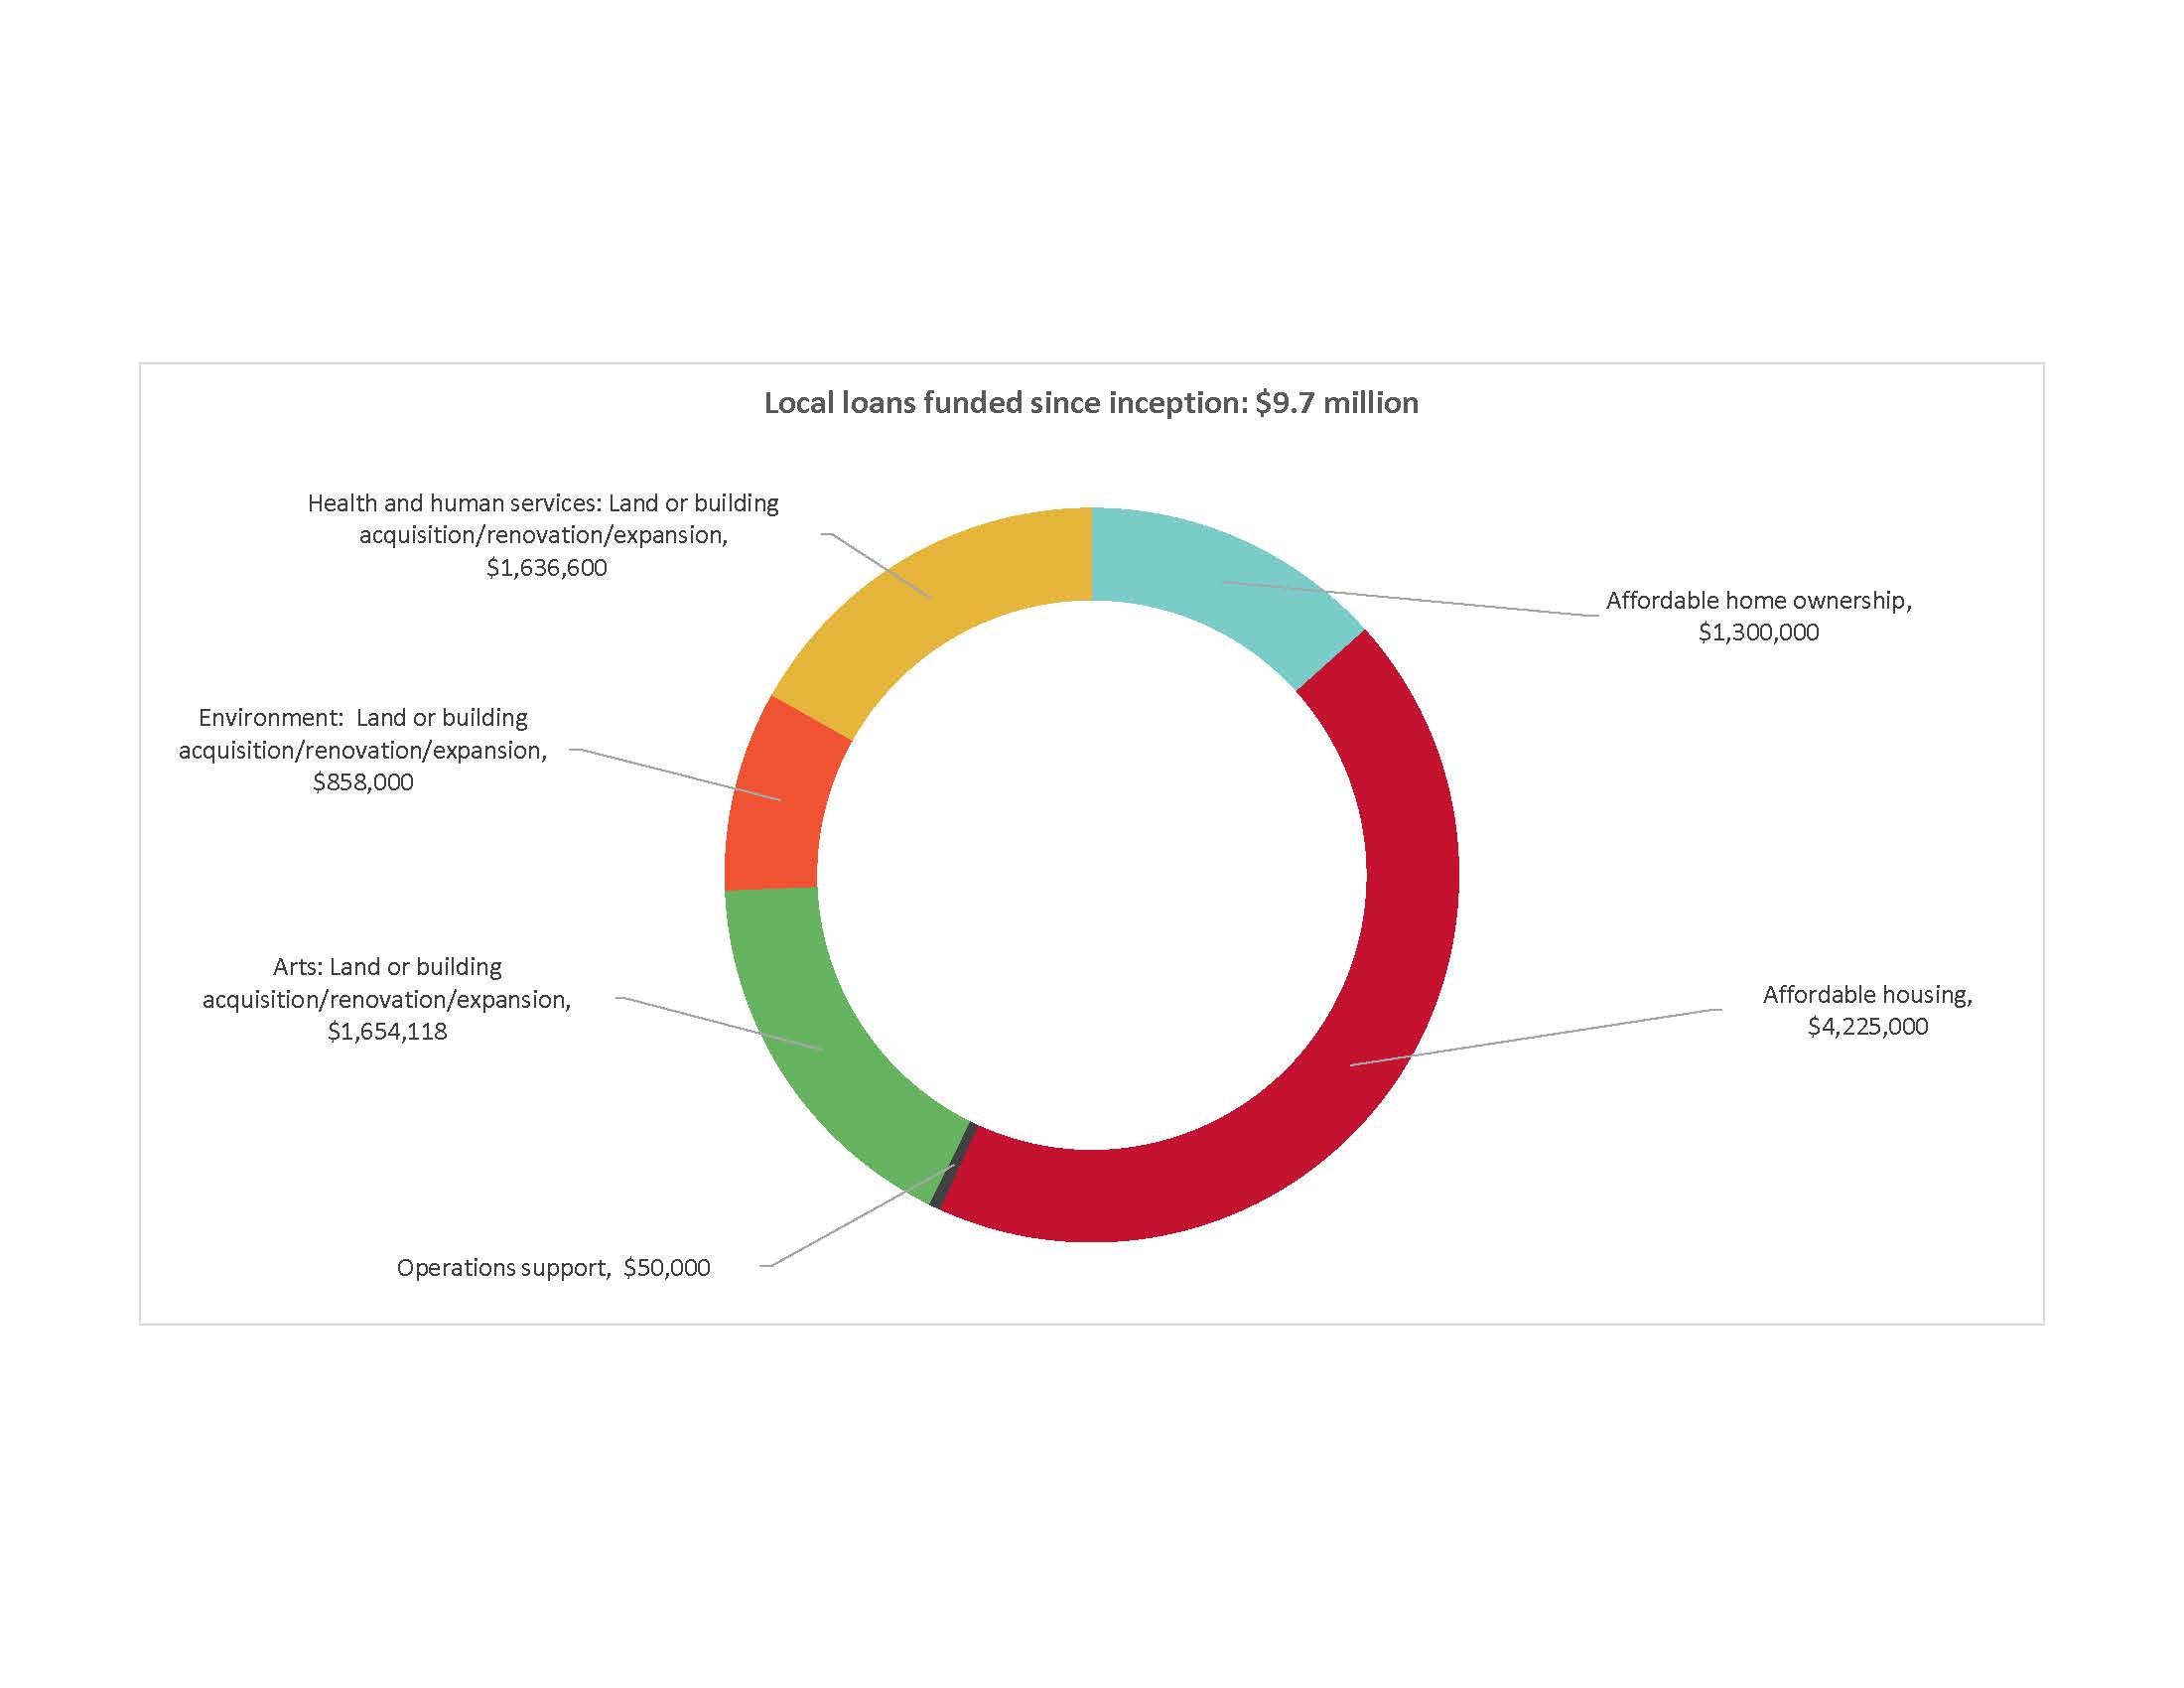
Local loans since inception total $9.7 million with $7.1 million outstanding at year end. Chart 6 shows the impact areas our loans have supported. Since the loan program’s 2012 inception, $2.6 million in loan principal has been repaid and recycled as new loans. In addition, the interest from these loans supports HCF granting.
Chart 6
IRP is a Government of Canada program being delivered nationally by partners including Community Foundations of Canada. As the first phase in the government’s long-term investment in social finance, the IRP’s goal is to make social-purpose organizations “investment ready” so they can make a difference in new and innovative ways through their participation in the social finance market. HCF has partnered with community foundations in London and Niagara, and the McMaster Innovation Park to manage the program regionally on behalf of Community Foundations of Canada. The first request for proposals for funding in January created enormous interest nationally and garnered 65 submissions to our regional partnership. Approved funding is expected to be released in June 2020. As an additional benefit, the IRP brought a growing number of potential opportunities for local loans to HCF’s attention.
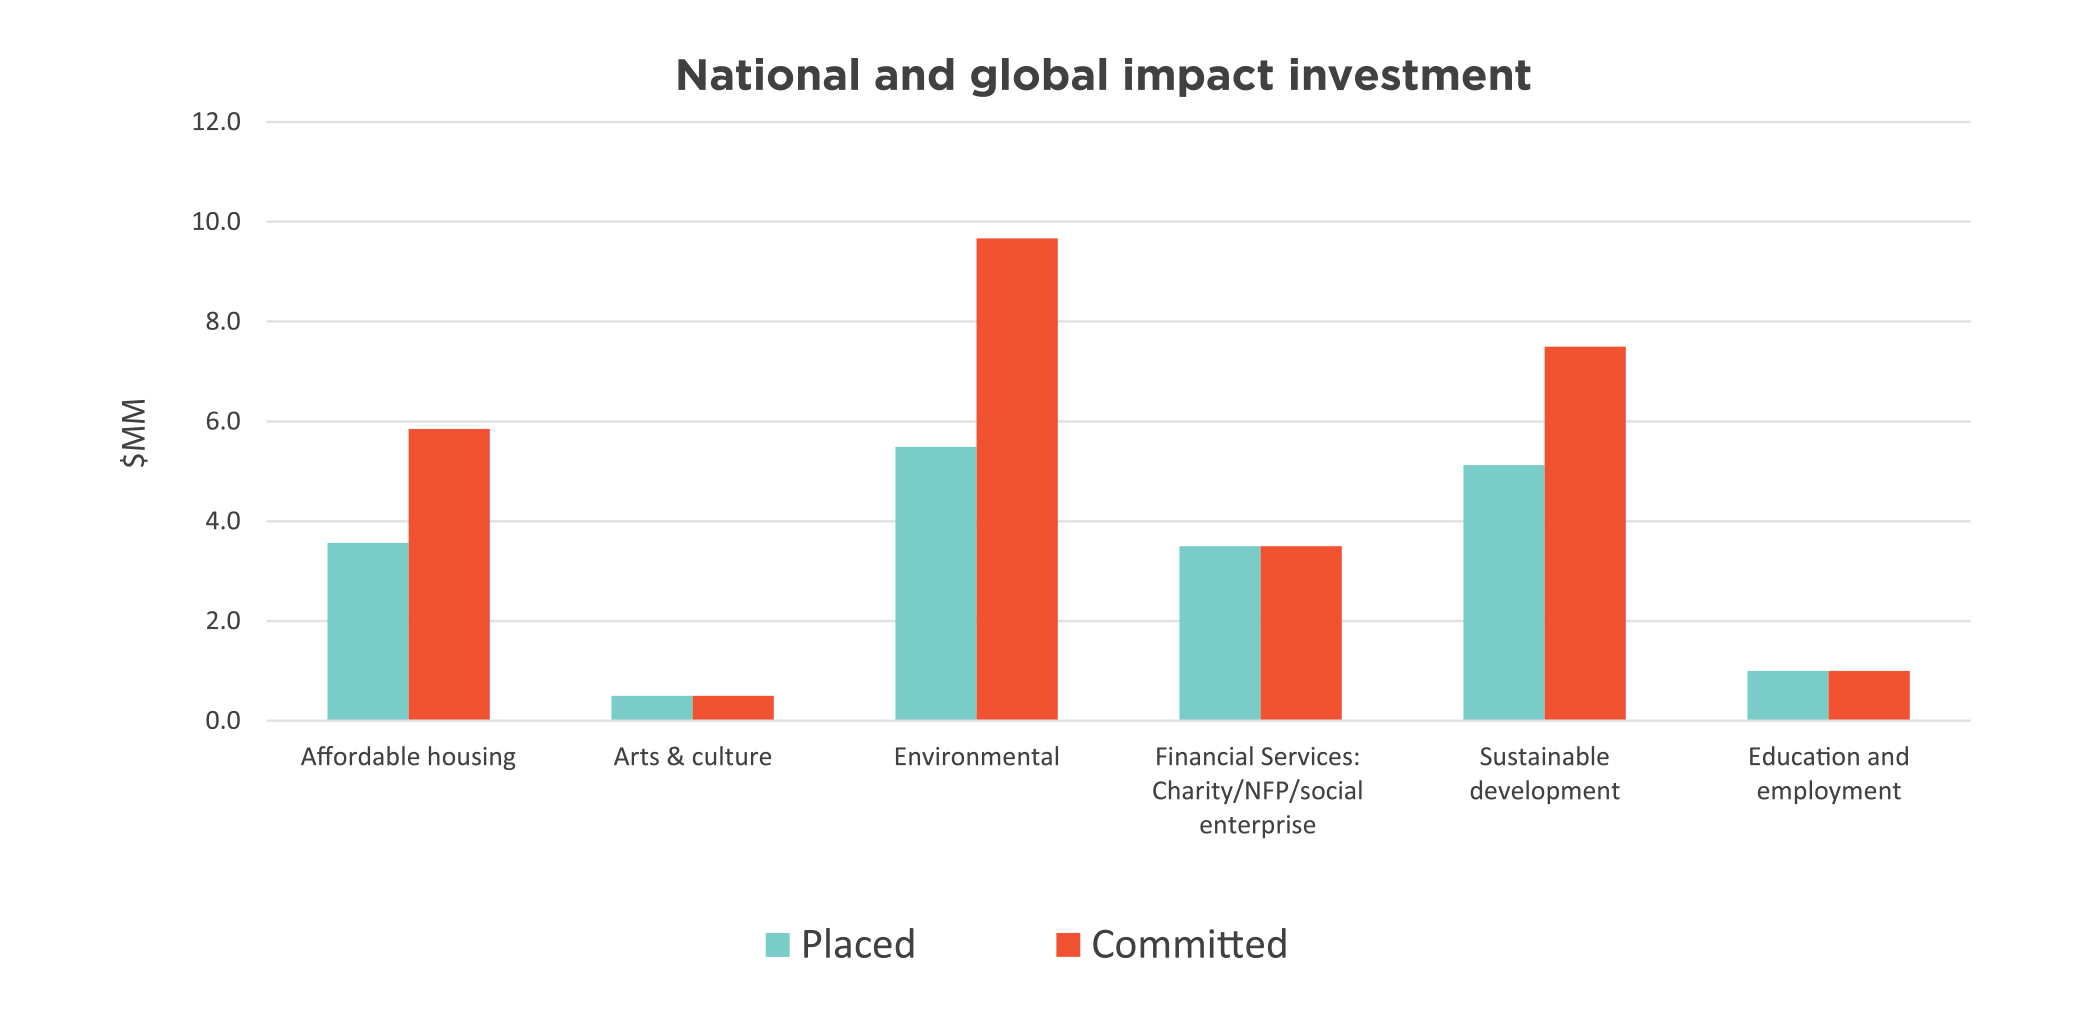
These investments include private equity, private debt and real estate investments. Many of these investments are long term in nature, are maintained at cost and do not have a regular income stream. As these investments are maintained at cost, their results include interest income and realized gains, but not unrealized gains. Results for these investments are closely monitored and are reported when realized. Chart 7 identifies the investment areas, with $18.0 million placed and a total commitment of $33 million across 21 investments.
Chart 7
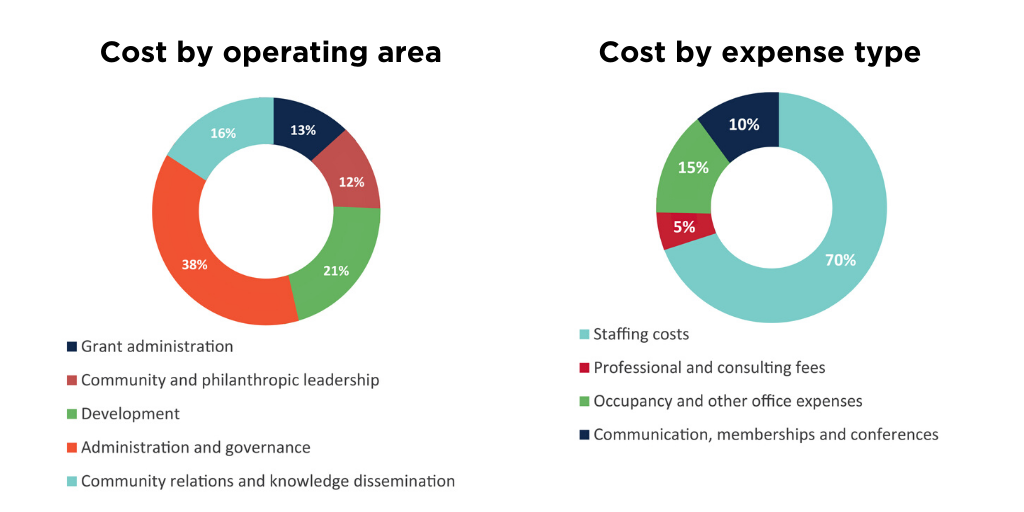
Operating expenses for the fiscal year ended March 31, 2020 total $2.5 million and were 2.5 percent higher than last year. Staffing costs related to the Foundation’s 22 employees represent 70 percent of HCF operating costs.
In addition to breaking out cost by type, operating costs are allocated to each of the Foundation’s operating areas: grants administration, community and philanthropic leadership, community relations and knowledge dissemination, development activities, and administration and governance. Examples of community and philanthropic leadership include convening around the city’s critical issues and fostering the growth of philanthropy by sharing staff time and knowledge to support other charities. Charts 8 and 9 illustrate these costs by operating area and by expense type.
Charts 8 and 9
The Foundation’s annual development expenses are not necessarily attributable to the donations received in that year. The nature of donations to the Foundation can result in costs preceding the receipt of the donation by several years (for example, donations through wills). As a result, consistent with the community foundation sector, operating costs are evaluated by a ratio of total operating expenses to average total assets. Ratios fall within a range depending on the size and stage of the community foundation’s development.
Management considers the ratio of 1.26 percent (1.25 percent in 2019), as illustrated in Chart 10, to be within an acceptable range for a foundation of HCF’s size, stage and level of community leadership, compared against benchmarks established in the community foundation sector. We continue to monitor both the actual results and the benchmarks on an ongoing basis.
Chart 10

Hamilton Community Foundation’s total assets of $201 million at March 31, 2020 include balances of HCF funds and funds held on behalf of others at $1.7 million.
Hamilton Community Foundation’s fund balances, illustrated in Chart 11, represent accumulated donations plus the net investment earnings on these donations, minus granting and operating costs. Funds include both endowed and flowthrough funds. Endowed funds are held permanently and grant from investment earnings. Flowthrough funds are fully distributed as grants over a pre-determined term.
Chart 11
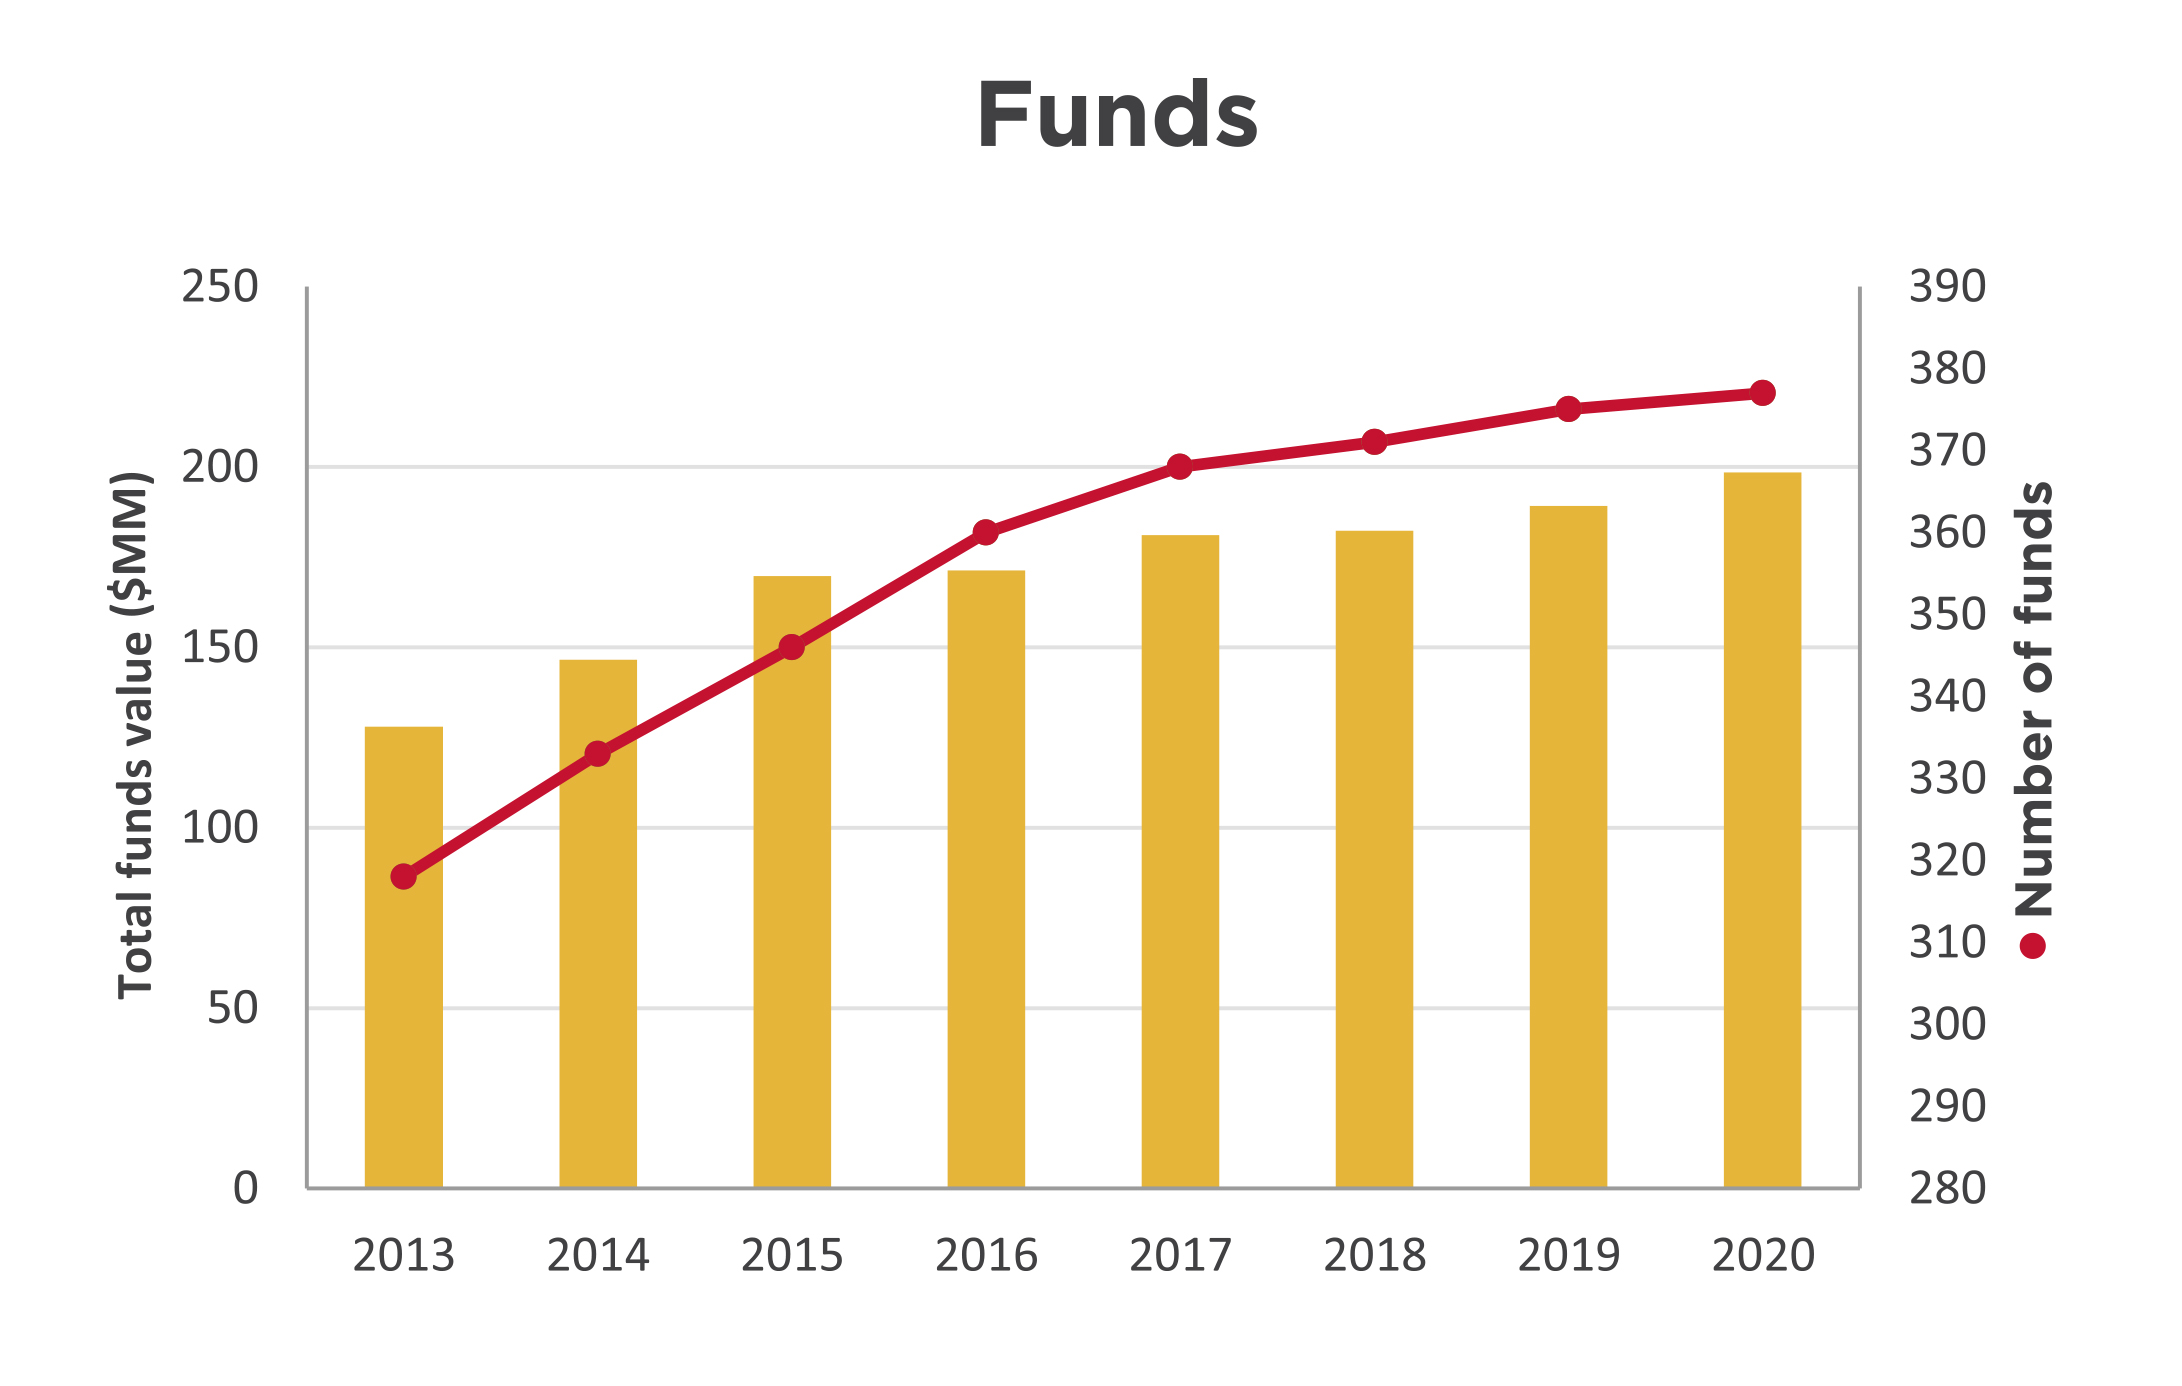
The fund balances have grown 55 percent to $198 million at the year ended March 31, 2020 from $128 million in 2013. Donations of $35.1 million included $4.4 million in flowthrough donations that were largely distributed as grants in the year and, as a result, do not remain in the fund balances at year end. This results in a modest total funds balance growth of 4.8 per cent for the year. The number of funds has grown 19 percent to 377 from 318 in 2013.
Auditors
BDO Canada LLP
Bankers & Custodian
Bank of Montreal and BMO Private Banking
Solicitors
Gowling WLG
Investment Managers
Connor, Clark and Lunn Private Capital Ltd.
Jarislowsky Fraser Ltd.
| Grants by recipient organization I-R | |
|---|---|
| ICNA Relief Food Bank | |
| Brant County | 10,000 |
| Imagine in the Park Children's Arts Festival/Rotary Club of Hamilton AM | |
| Supporting grant * | 3,000 |
| Industry Education Council of Hamilton | |
| Hamilton Code Clubs * | 176,430 |
| Indwell Community Homes | |
| Encouraging creativity and art expression * | 2,000 |
| Supporting grant * | 1,000 |
| Interval House of Hamilton | |
| Be More Than a Bystander | 1,000 |
| Mom's Rock | 5,000 |
| Supporting grant | 9,603 |
| The Hero's Journey Program * | 10,000 |
| Jazz.FM91 Inc. | |
| Supporting grant | 598 |
| The John Howard Society | |
| ACHIEVES * | 180,000 |
| YARD program * | 60,937 |
| Joseph Brant Hospital Foundation | |
| Supporting grant | 10,500 |
| Journalists for Human Rights | |
| Supporting grant | 50,000 |
| Jump In Foundation | |
| Physical activation program | 10,000 |
| Jump Math | |
| Supporting grant | 50,000 |
| Juravinski Hospital & Cancer Centre Foundation/Hamilton Health Sciences Foundation | |
| Supporting grant | 2,000 |
| Juvenile Diabetes Research Foundation | |
| Supporting grant | 1,145 |
| Kitchener Waterloo Community Foundation | |
| Green Shield Canada Sherry Peister Community Impact Fund | 490,000 |
| Lake Avenue Elementary School/Hamilton Foundation for Student Success | |
| Flash mob presentations | 3,000 |
| Makerspace Across the Grades | 5,000 |
| L'Arche Hamilton | |
| Community Café | 23,270 |
| Creative Hands Art Studio * | 9,725 |
| Supporting grant | 650 |
| Learning Disabilities Association of Halton | |
| Reading Rocks expansion and subsidies * | 2,500 |
| Reading Rocks literacy intervention * | 7,225 |
| The Learning Partnership | |
| Entrepreneurial Adventure * | 10,000 |
| Supporting grant | 25,000 |
| Let's Talk Science | |
| Youth in a digital future * | 10,000 |
| Supporting grant | 25,000 |
| Liberty for Youth | |
| Bright Choices * | 10,000 |
| Prodigal Sonz * | 5,000 |
| Lighthouse Program for Grieving Children | |
| Supporting grant | 3,000 |
| Lions Foundation of Canada | |
| Autism Assistance Dog Guide Program | 2,000 |
| Canine Vision Canada | 1,785 |
| Wishlist | 1,000 |
| Living Rock Ministries | |
| Arts of August | 1,400 |
| Operation Christmas Blessing | 4,000 |
| Pandemic relief * | 20,000 |
| Rock Resources | 25,000 |
| Street-involved young moms | 650 |
| Supporting grant | 2,000 |
| Supporting grant * | 8,007 |
| Weekend program | 11,609 |
| Loran Scholars Foundation | |
| Supporting grant | 80,000 |
| Lynwood Charlton Centre | |
| Under the Willows | 20,000 |
| Supporting grant * | 4,402 |
| MacNab Street Presbyterian Church | |
| Supporting grant | 11,959 |
| Make-A-Wish Foundation | |
| Supporting grant | 500 |
| March of Dimes Canada Non-Profit Housing Corporation | |
| Jason's House | 2,000 |
| MaRS Discovery District | |
| Centre for Impact Investing | 75,000 |
| Solutions Lab | 150,000 |
| SVX | 25,000 |
| Mathstronauts/McMaster University | |
| STEAM Engine Program * | 38,390 |
| McGill University | |
| Friends of McGill Hockey | 200 |
| School of Nursing | 2,000 |
| McMaster University | |
| Art Gallery | 2,000 |
| McMaster Community Poverty Initiative | 2,500 |
| MCYU and Neighbour to Neighbour Mentorship Program * | 18,700 |
| Midwifery bursary | 10,000 |
| Museum of Art | 1,940 |
| Mealshare Aid Foundation | |
| Tackling Youth Hunger in Hamilton | 20,000 |
| Melrose United Church | |
| Supporting grant | 6,238 |
| Mission Services of Hamilton | |
| Pandemic relief * | 25,000 |
| Supporting grant | 11,704 |
| The 196 * | 124,950 |
| Youth Wellness Program | 15,000 |
| Missionaries of Charity | |
| Supporting grant | 200 |
| Mohawk College | |
| Pathfinder Program | 35,000 |
| MADD Canada | |
| SmartWheels | 2,000 |
| Musicata | |
| Supporting grant | 2,000 |
| Muskoka Conservancy | |
| Supporting grant | 2,000 |
| Neighbour to Neighbour Centre (Hamilton) | |
| Children and Senior Chinese Community Folk Dance * | 500 |
| Community Food Centre - Peer Advocate Skills Mentorship | 2,000 |
| Eco-Explorers and Eco-Advocates * | 10,000 |
| Food skills programming | 15,000 |
| Jack Parent Reading Program | 1,040 |
| Jack Parent Reading Program * | 15,000 |
| Math Success Program * | 52,000 |
| Pandemic relief * | 20,000 |
| Net Ministries of Canada | |
| Supporting grant | 2,000 |
| Never Gonna Stop Community Centre for the Arts/Hamilton Centre for Civic Inclusion | |
| Summer programming * | 2,000 |
| New Hope Community Bikes | |
| Ride Smart * | 10,000 |
| New Vision United Church | |
| Supporting grant * | 10,084 |
| Niwasa Kendaaswin Teg | |
| Completing the Circle | 25,000 |
| NYA:WEH Elementary - HWCDSB * | 180,000 |
| NYA:WEH Elementary - HWDSB * | 360,000 |
| Traditional Knowledge and Skills Outreach * | 20,000 |
| No. 9 Contemporary Art & the Environment | |
| Imagining My Sustainable Community Hamilton * | 44,000 |
| Notre-Dame de Perpetual-Secours | |
| Supporting grant | 23,200 |
| The Owl Foundation | |
| Supporting grant | 4,500 |
| Paroisse Saint-Philippe | |
| Supporting grant | 8,000 |
| Pathways to Education Canada | |
| Supporting grant * | 10,000 |
| Philpott Memorial Church | |
| Supporting grant | 9,096 |
| Players' Guild of Hamilton Inc. | |
| Supporting grant * | 5,105 |
| Prince of Wales Public School / Hamilton Foundation for Student Success | |
| Healthy Cooking on a Budget | 5,000 |
| Queen Mary School / Hamilton Foundation for Student Success | |
| Student programming | 5,000 |
| Rainbow Railroad | |
| Supporting grant | 10,000 |
| Rainbow's End Community Development Corporation | |
| Growing Strong | 25,000 |
| Re-create Outreach Art Studio/Shalem Mental Health Network | |
| Art Journaling: Drawing our way towards mental health * | 3,839 |
| Textile Stories * | 11,425 |
| Redeemer University College | |
| Supporting grant | 4,000 |
| The Rob Freeman Foundation | |
| Supporting grant | 2,500 |
| Robert Land Community Association/Eva Rothwell Centre | |
| Supporting grant | 4,424 |
| Roman Catholic Episcopal Corporation of the Diocese of Hamilton | |
| Haiti Fund | 2,000 |
| One Heart, One Soul Campaign | 10,000 |
| Roman Catholic Episcopal Corporation St. Ann's Parish | |
| Supporting grant | 8,000 |
| Rotary Club of Hamilton AM | |
| Imagine in the Park Children's Arts Festival | 3,000 |
| Rotary Club of Hamilton Sunshine Fund | |
| Children's Christmas Celebration | 2,650 |
| CORE Kids - Youth Achievers Program * | 25,000 |
| Supporting grant * | 8,007 |
| Royal Botanical Gardens | |
| Supporting grant | 11,871 |
| Supporting grant * | 3,883 |
| Royal Canadian Humane Association | |
| Supporting grant * | 3,621 |
| Royal Conservatory of Music | |
| Supporting grant | 500 |
| Rygiel Homes Housing Corporation | |
| Supporting grant | 1,000 |
| Rygiel Supports for Community Living | |
| Supporting grant | 2,274 |
| Supporting grant * | 1,713 |
This fund is used to address the highest charitable priorities in the community.
| Fund | Amount |
|---|---|
| #HamOnt Forever Fund | 5,000 |
| A. May Davis Fund | 41,598 |
| A.H. Tallman Bronze Co. Ltd. Fund | 21,790 |
| Alfred Charles & Pearl Gertrude Swanwick Fund | 200,000 |
| Alice Redman Gooch Fund | 25,025 |
| Alice Vera Morgan Fund | 338,065 |
| Alphonse Dirse Fund | 48,344 |
| Anne M. Biggar Fund | 460,327 |
| Annie S. Nieman Fund | 36,081 |
| Anonymous fund | 81,942 |
| Averil Gray & Florence Gray Fund | 1,172,308 |
| Bertha Savage Fund | 47,806 |
| Brenda & Reg McGuire Fund | 5,150 |
| Brenda Morris Fund | 5,000 |
| Cameron K. MacGillivray Fund | 9,325 |
| Caroline May Alvey Fund | 118,000 |
| Catherine C.H. Murray Fund | 50,050 |
| Charles & Catherine Ralph Fund | 43,131 |
| Charlotte Cauley Fund | 34,987 |
| Christina Cooper Fund | 173,405 |
| Christina I. Hammant Fund | 250,000 |
| Clare B. Hunter Fund | 13,079 |
| D. Argue Martin Fund | 20,340 |
| Dan and Helen Geagan Fund | 20,174 |
| Daniel T. Lawrie Fund | 115,529 |
| Diffey Family Fund | 5,000 |
| Donald A. Cooper Fund | 40,126 |
| Donald & Alice Cannon Fund | 14,625 |
| Donald H. Henderson Fund | 408,597 |
| Donald J. Allan Fund | 103,514 |
| Doreen & Gordon Birk Fund | 98,409 |
| Doris M. Allen Fund | 172,918 |
| Dorothy & Travice Broadbent Fund | 7,000 |
| Dorothy Cauley Fund | 78,831 |
| Dorothy I. Linfoot Fund | 20,588 |
| Dr. Alexander A. Numbers Fund | 5,844 |
| Dr. Carl Martin Memorial Fund | 5,000 |
| Dr. Ronald P. Graham Fund | 16,814 |
| E. Francis Dennee Fund | 24,322 |
| Edna E.R. Reeves Fund | 78,766 |
| Edna Fern Flewelling Fund | 29,761 |
| Edna Robertson Memorial Fund | 29,000 |
| Eleanor Foster Fund | 869,072 |
| Eleanor Jean Milton Fund | 63,610 |
| Eleanor M. Smith Fund | 10,000 |
| Elizabeth Lee Fund | 11,775 |
| Elizabeth Mary Hamilton Fund | 30,000 |
| Elsie M. Husband Fund | 12,300 |
| Erie Hossack Fund | 58,638 |
| Erma Z.L. Goering Fund | 888,437 |
| Ernest & Ruth Brunton Fund | 28,000 |
| Ethel H. Prouse Fund | 181,684 |
| Eulalia D. Wall Fund | 170,977 |
| Evelyn & Richard Geraghty Storms Memorial Fund | 25,000 |
| Evelyn Patricia Lyons Fund | 5,000 |
| Fell Family Fund | 38,065 |
| Flora L. McNeil Fund | 30,165 |
| Florabel Condy Fund | 25,000 |
| Frances W. Ambrose Fund | 5,600 |
| Francis Spence Hutton Fund | 32,650 |
| Frederick J. Mills Fund | 26,189 |
| Gallagher Family Fund | 82,700 |
| George Earle Drewett and Arline Myra Drewett Memorial Fund | 50,000 |
| Gilbert P.V. Belton Fund | 175,088 |
| Gladys A. Whittaker Fund | 26,205 |
| Gordon & Ethel Holmes Fund | 97,572 |
| Grace J. Smith Fund | 13,030 |
| Hanna & Joseph Dubeck Fund | 5,000 |
| Harold E. Clarke Fund | 86,120 |
| Harvey and Audrey Smith Fund | 544,860 |
| Helen Gertrude Harrison Fund | 34,222 |
| Helen Mary Archambeault Fund | 25,316 |
| Henrietta F. Campbell Fund | 104,959 |
| Herbert P. and I. Flora Frid Fund | 354,466 |
| Horace A. Bennett Fund | 10,000 |
| Howard & Edna Tugman Memorial Fund | 100,000 |
| Ian & Donna Cowan Fund | 5,750 |
| Irene Caldwell Memorial Fund | 10,000 |
| J.M. Walter Hahn Fund | 5,000 |
| Jack A. Winser Fund | 155,007 |
| Jack McNie Fund | 26,000 |
| James & Irene Wilson Fund | 6,000 |
| James & Mary Phin Fund | 106,545 |
| James D. Redmond Fund | 6,033 |
| Jane Milanetti Fund | 13,450 |
| Jessie Rumney Fund | 10,000 |
| Joan W. Rutherford Fund | 5,000 |
| John and Joan Bothwell Fund | 10,000 |
| John H. Frid Fund | 548,347 |
| John Shea Memorial Fund | 8,387 |
| Josephine Magee Fund | 204,057 |
| Kathleen L. McBride Fund | 11,632,794 |
| Kathryn Jones Fund | 30,186 |
| Lakin Family Fund | 14,580 |
| Laurence Cholwill Patterson Fund | 351,146 |
| Leanora M. Spicer Fund | 26,600 |
| Lillian Boyd Barnby Fund | 10,000 |
| Lindsay M. McLennan Fund | 78,022 |
| Lois G. Greenall Fund | 145,085 |
| Lulu Blanche Hart & Harry Utter Hart Memorial Fund | 778,782 |
| M. Jessie Chagnon Fund | 71,196 |
| Mabel Beatrice Studd Fund | 15,000 |
| Mabel D. Leadlay Fund | 75,891 |
| Margaret & William Gilmour Fund | 8,380 |
| Margaret Anne Hayward Fund | 797,598 |
| Margaret E. Tschetter Fund | 383,739 |
| Marjorie L. Allan Fund | 5,000 |
| Marjorie Wild Fund | 30,724 |
| Marnie & Bill Brehm Family Fund | 39,500 |
| Marnie Spears Fund | 22,195 |
| Martha McKinnell Serrels Fund | 94,682 |
| Mary & Earl Brooks Fund | 1,354,969 |
| Mary E. Hatch Fund | 116,000 |
| Mildred E. Hunter Fund | 100,878 |
| Mount Hamilton United Church Legacy Fund | 20,000 |
| Noreen & Seymour Wigle Fund | 15,000 |
| Patricia Eileen Smith Fund | 5,150 |
| Peter & Rose Marie Palmer Fund | 7,385 |
| Petra Cooke Memorial Fund | 31,300 |
| Project Sunday Fund | 8,771 |
| Ralph E. Ingraham Fund | 16,017 |
| Ralph W. & Evelyn J. Cooper Fund | 151,000 |
| Renate & Bob Davidson Fund | 11,000 |
| Reynolds Family Fund | 141,839 |
| Robert C. & L. Ann Glass Fund | 100,000 |
| Robert D. Crockford Fund | 14,075 |
| Robert George Sparre Fund | 34,410 |
| Robert J. & Joan Harrison Fund | 10,266 |
| Robert P. McBride Fund | 1,636,012 |
| Royal Hamilton College of Music Faculty Fund | 5,963 |
| Russell & Mae Lindley Fund | 10,400 |
| Ruth G. & Fred J. Spencer Fund | 23,000 |
| The Samuel & Dora McFarlane Fund | 14,000 |
| Samuel Ringer Fund | 70,586 |
| Sandra & John Black Fund | 160,594 |
| Sarah Smith Fund | 230,729 |
| The Spectator Fund | 10,000 |
| Stait Family Fund | |
| Stewart Philp Fund | 45,000 |
| Tim and Dale Langs Fund | 189,409 |
| Tod Laing Fund | 7,950 |
| The Unicorn Fund | 12,611 |
| Vangie M. Crosthwaite Fund | 41,292 |
| Vera M. Elwin Fund | 536,235 |
| Vincenza Travale Fund | 21,200 |
| W. Jones Fund | 25,920 |
| West-Moynes Fund | 8,500 |
| Wheeler Family Fund | 10,900 |
| William F. Brand Fund | 8,404 |
| William Gordon Kitchener Fund | 60,000 |
| William S. Sparham Fund | 25,236 |
| Thank you to our 2019-20 donors: | ||
|---|---|---|
| Layla Abdulrahim-Moore | Matt & Sarah Goodman | Scott Page & Vanessa Foreman Page |
| Mary Aduckiewicz | Susan Goodman | Peter & Rose Marie Palmer |
| Agro Zaffiro LLP | Grant Thornton LLP | Michael Parente |
| Jane E. Allison | Green Shield Canada | Jane E. Peacock |
| Jane Anderson | Lisa Habisreutinger | Jennifer Pearson |
| Jill Anderson | Tanis Hall | Terri Petrachek |
| Peter Anderson | Brian & Morag Halsey | Raong Phalavong |
| Maria Antonakos | David Hamber | Shirley Picken |
| Annette Aquin & David Malcolm | Hamilton Foundation for Student Success | The Pioneer Group Inc. |
| Callie Archer | Hamilton Health Sciences Corporation | Steve & Mary Prime |
| H. Anthony & Anne Arrell | Hamilton Law Association | Elisha Proietti |
| The Honourable Harrison S. Arrell & Diane Arrell | Hamilton Technology Centre | Punk Rock Realty, Inc. |
| The Atkinson Charitable Foundation | Annette Hamm | Judith Pyke |
| Robert & Carol Balint | Elizabeth Harris | Rally Assets Inc. |
| JoAnne Barresi | Roberta D. Harris | Carol Rand |
| Glenn & Kim Barrett | Barbara Harwood | Gail Rappolt |
| Dr. Philippe & Mary Barrette | Rhoda Hassmann | Diane Rawsthorn |
| Bay Area Science & Engineering Fair | Hasty Market Corporation | Jim Ray & Annette Dufresne-Ray |
| Bentley Systems, Incorporated | Ruth Hatch | Paul Ray |
| Robert P. Beres | Maureen Hayes | Brian Reid |
| Robert & Marion Bethune | Dr. Joan B. Heels | Heather Rex |
| Bike for Mike supporters | Corey Helie-Masters | Gabrielle Richards |
| Charles & Rosi Bisaro | Rob & Tami Henderson | Don & Ann Ridpath |
| John & Sandra Black | Heidi Henschel | Rise and Shine-Strategic B2B Content Marketing |
| Julie Boateng | Thomas A. Hickey | Carol Ritchie |
| Katharine L. Borczak | Higher Education Quality Council of Ontario (HEQCO) | Tanya Ritchie |
| Edward G. & Karin Bossence | Geoffrey H. Hogarth | Susan M. Roberts |
| Duane Bouyea | Cathy Holland | Gail Robinson-Gow |
| Katherine Braedley | Assad Hoosein | Barbara E. Rogers |
| Maria Bragues | Nathan H. Hough | Larry Roos |
| Bill & Marnie Brehm | Wendy J. Hough | Rotary Club of Hamilton Sunshine Fund |
| Adele Brierley | Emily M. Hunt | Nancy K. Rundle |
| Ray Brillinger & Cy Hack | Bruce & Linda Hutchinson | John & Dr. Leila W. M. Ryan |
| Broadcast Services International Inc. | The Hutton family | Sheila Sammon |
| Hazel M. Broker | Dean Jeffries | Brennan Sarich |
| Browne Law Office Professional Corporation | Shirley A. Johnson | Stu Saunders |
| Ernest & Ruth Brunton | Nigel Johnston | Bob & Peggy Savage |
| Burlington Parks & Open Space Friends | Rosalind Johnston | Erik Schaefer & Amy Lazier Schaefer |
| Mary Buzzell | Jim Jones | Sandy J. Schwenger |
| Cake & Loaf Bakery Ltd. | Kabuki Spa & Skin Centre | Stan & Keitha Seneco |
| Dr. Gordon Cameron | Greg & Danielle Kaiser | Lori Serafini |
| Neil & Judy Cameron | Barry J. Kay | Karen Shaver |
| Ward Campbell | Jennifer Kaye | Donna Sheldrake |
| Alice A. Cannon | Katharine R. Kingsmill Marsales | Courtney Sheppard |
| Janet E. A. Cannon | Carolyn Kinsley | Jonathan Shrubsole |
| Paul & Sara Cannon | Helen Kirkpatrick | Risa Shuman |
| Stewart & Jane Capell | Rob & Melissa Klaver | Teresa Silvestro |
| Richard & Carole Capling | Mike A. Kluk | John Simpson |
| Mike Carnegie | Marinus J. Kok | Kim Smith |
| Dr. Ignacio Castillo | Miriam P. Kramer | Teresa Smith |
| Sharon Charters | John Krawchenko | Melanie Sodtka |
| Denise Christopherson | Alyssa Lai | Marnie Spears |
| Benjamin J. Ciprietti | Sara Laidlaw | St. Joseph's Health System |
| City of Hamilton | Paul & Pam Lakin | Victoria Staite |
| Alan & Marlies Clark | Stuart Laurie | Sandra Stephenson |
| John Clinton | Janice M. Lawson | Doreen Stermann |
| Derek Collins | Melissa Leaist | Patrick K. Sun |
| Columbia International College | Ann Leon | Carolyn F. Swadron |
| Connor, Clark & Lunn Foundation | Elizabeth Lesser | Charles & Ret Swire |
| Conserver Society of Hamilton & District, Inc. | Dr. Mark & Hinda Levine | Glen & Debra Swire |
| Terry Cooke & Maureen Wilson | Joy Levy | Elisha Szafran |
| William Cooke | Angel Li | Pauline Taggart |
| Elizabeth Coons | Dr. Dana Liang | Rose Taylor-Weale |
| Chantal Copithorn | Celeste Licorish | Anne Tennier |
| Georgia Corkins | Lodge of the Ancient Landmarks | Dr. Robert & Deborah Tester |
| R. Ian Cowan | Losani Family Foundation Fund supporters | Joshua E., Amy & Liam Thorne |
| Jeannie Crawford | Joan Lowry | Margaret E. Thurston |
| Robert D. Crockford | John MacDonald & Susan Greer | Helen Tomasik |
| Francina Cunningham | Shylah MacIntyre | Dr. Ninh Tran & Sarah Bennett |
| Margaret Cunnington | Alix MacLean | Vincenza Travale |
| Ray & Joanne Cunnington | E. Shirley Macnamara | Ross & C. Anne Tucker |
| Lisa Dalia | Jean Madadi | Kerry Turcotte |
| Dr. Juliet Daniel | Dr. Kim Madden | Laura Turkstra |
| Kenna-Lynn Danyliw | Maple Leaf Centre for Action on Food Security | Peter & Karen Turkstra |
| Dr. Liane Davey | Rick & Anne Martin | Sarah Turkstra |
| Bob & Renate Davidson | Ginny Mattuzzi | Laura Tutte |
| Rosaline Dean | Mary McClelland | Kenneth J. Tyler |
| Paul Del Bello | Stacie McCormick | Unicorn Rebellion |
| William M. & Susan J. Dell | Sheila M. McDougall | UnMarketing Inc. |
| Sabrina Denicola | James & Laura McGrath | Mark & Jentine Van Beveren |
| Francis A. DeSantis | Dr. Don & Kathryne McLean | Joan Van Damme |
| Alan R. & Joan Dessau | McMaster University | Paul Vayda |
| Lori Dessau Tauber | McMaster University Women’s Health Review | Vincero Capital Management Inc. |
| Terry & Grace Diffey | Wendy McNally | Alan & Janet Walker |
| Kevin & Karen Dore | Rev. Alan & Maureen McPherson | Geoffrey F. & Joan Walker |
| Dr. Bob Kemp Hospice Foundation | Archie J. McQueen | Randall E. Walker |
| Sandra L. Edrupt | The Honourable Derek Mendes da Costa | Barbara J. Wallace |
| Julie Ellis | Virginia Mendes da Costa | Patricia A. Walsh |
| William Ernst | Grahame & Sheree Meredith | Yulena Wan & Scott Newport |
| Dr. Bill & Jane Evans | Ruth Merz | Sarah Wardrope |
| Lois Evans | The Honourable Jane A. Milanetti | Dr. Gary & Joy Warner |
| The Fairmount Foundation | John Mills Sr. | Kathy Watts |
| Kate Feightner | Paul & Carolyn Milne | Dr. Sarah Wayland |
| Don Fell | Martha Mitchell | Beth Webel |
| Fengate Asset Management | Alan Moffett | Trevor Westerhoff |
| The Honourable William Festeryga & Doris Festeryga | Mortgage Teacher | Kate Whalen |
| Find the Red Thread | Jenna Morton | Jean & John Wheeler |
| Margaret Fischbuch | Dr. Henry & Betty Muggah | Rob Wiersma & Tracy Varcoe |
| Frank & Lydia Fitz | Christina Mulder | Boris Williams & Sunniva Buskermolen |
| Peter & Gaye Fletcher | Justin Mulder | Gwyn & Gail Williams |
| Tom Flood | William & Patricia Mungar | Peter B. Williamson |
| FMC Truck Auto & Marine | Sarah M. Murphy | Robin L. Williamson |
| Freewheel Cycle Inc. | Joyce Neal | Richard Wilson |
| Melanie Froese | Richard Nelson | Veronica Wilson |
| Patricia Fulton | Christopher Nichols | The Winnipeg Foundation |
| Paul Gibel | John & Anna M. Nisbet | Marnie Wolfe |
| Mary S. Gilmour | Dermot P. Nolan | Marita Zaffiro |
| Richard & Justine Giuliani | Erin O'Neil | Juliana Zaremba |
| Patricia Glover | Gerry & Sheila O'Reilly | Zonta Club of Hamilton I |
| Bruce Goodbrand & Donna Tweedell | Eileen Page | |
| We would like to acknowledge those people who made a direct financial contribution to ABACUS in 2019-20: | ||
|---|---|---|
| Bentley Systems, Incorporated | Sarah Glen | Dr. Henry & Betty Muggah |
| The Fairmount Foundation | Lisa Habisreutinger | Rose Taylor-Weale |
| Grants from designated funds | Amount |
|---|---|
| Adam and Olive Clark Memorial Fund | 15,742 |
| Anonymous | 188,522 |
| Art and Barb Worth Fund | 5,838 |
| Barbara and Ronald Bayne Fund | 3,206 |
| Cygnus Fund | 1,812 |
| Douglas J. Clark Fund* | 6,191 |
| Eva Rothwell Resource Centre Fund | 4,424 |
| Frank Charles Miller Fund* | 85,237 |
| James P. & Mary S. Phin Charitable Fund | 10,098 |
| Joe, Filomena and George Seliga Holdings Fund | 109,753 |
| Phenix Fund for Animal Welfare | 5,670 |
| Samaritans' Tithe Fund | 13,277 |
| Stoney Creek Health Fund | 37,860 |
| United Nations Culture of Peace Hamilton Fund | 1,265 |
| United Way Fund/Kenneth R. Walsh | 11,201 |
| Walter & Mildred Danby Fund* | 22,739 |
| TOTAL | 522,835 |
| Grants from scholarships and bursary funds | Amount |
|---|---|
| Albert & Betty Walters Fund | 400 |
| Amanda Marie Cowan Memorial Scholarship Fund | 1,284 |
| Bernie Morelli Memorial Bursary Fund | 1,339 |
| Charlie and Mabel Duncan Memorial Bursary Fund | 1,339 |
| Christina Hamilton Scholarship Fund | 4,232 |
| Cowan Family Fund | 2,416 |
| CPRS Hamilton Legacy Fund | 2,000 |
| Daniel Giannini Fund | 45,000 |
| Eugene B. Eastburn Fellowship Fund | 90,000 |
| General Bursary Fund/Genevieve A. Chaney & Cordelia C. Ensign | 34,666 |
| Geritol Follies Bursary Fund | 11,500 |
| Howard Fairclough Organ Scholarship Fund | 2,600 |
| James Darby Bursary Fund | 6,800 |
| Jeff Dickins Memorial Fund | 1,000 |
| Jervis B. Webb Company of Canada (Daifuku) Scholarship Fund | 27,500 |
| John E. VanDuzer Scholarship Fund | 2,000 |
| Mildred Dixon Holmes - Artist of the Year Fund | 2,000 |
| Music Bursary Fund | 1,934 |
| Ross F. Webb Bursary Fund | 3,267 |
| Rundle Foreign Study Bursary | 2,500 |
| Russell & Elizabeth Lindley Fund | 7,618 |
| William Allison Haynes Fund | 3,400 |
| TOTAL | 254,795 |
| Grants from donor-advised funds | Amount |
|---|---|
| Ambery Fund | 80,000 |
| Anonymous | 325,872 |
| ArcelorMittal Dofasco Children and Youth Fund | 11,609 |
| Bisaro Family Fund* | 2,843 |
| Chedoke Health Foundation Fund | 150,840 |
| Clark Family Foundation Fund | 53,000 |
| Cooke Family Fund* | 1,027 |
| David Davis Memorial Fund | 1,000 |
| Dr. Bob & Mildred Kemp Palliative Care Education Fund | 5,000 |
| Ed Smee Conserver Society Environmental Fund | 6,429 |
| Edith H. Turner Foundation Fund | 509,314 |
| Elham & Joseph Farah Family Foundation Fund* | 8,185 |
| Ella Baird & Grace Baird McQueen Memorial Fund/A.J. McQueen | 2,261 |
| Ellen Creaghan Fund | 30,000 |
| Fengate Community Foundation Fund* | 27,068 |
| Fengate Recreation Fund | 22,725 |
| The Gilmour Fund | 20,000 |
| Glen & Debra Swire Fund | 3,030 |
| Great Lakes Trust Fund* | 981 |
| Green Shield Canada Community Granting Fund | 2,270,000 |
| Hamilton Spectator Summer Camp Fund | 60,930 |
| Heather & Ross Hamlin Fund* | 593,267 |
| Heels Family Vocal Award Fund* | 13,029 |
| Hogarth Family Foundation Fund | 303,000 |
| Hugh C. Arrell Memorial Fund | 3,500 |
| Hundred Waters Foundation Fund* | 1,552 |
| Hutton Family Fund* | 103,334 |
| John & Esther Marshall Memorial Fund | 11,901 |
| John & Mary Reesor Fund | 7,710 |
| Kathleen C. Nolan Education Fund | 1,940 |
| Kirkpatrick Fund | 3,500 |
| Lawyers' Legacy for Children the Ray Harris Fund | 15,131 |
| Lee Hepner Award Fund | 1,800 |
| Lois Evans Natural Heritage Fund | 7,500 |
| Losani Family Foundation Fund | 95,000 |
| The Malloch Foundation Fund | 30,000 |
| Maple Leaf Centre for Action on Food Security Fund | 73,875 |
| Mark & Barbara Nimigan Fund | 4,000 |
| Marlies & Alan Clark Fund | 81,000 |
| The Martin Foundation Fund | 77,825 |
| Mayberry Family Fund* | 10,683 |
| McCallum, McBride Fund | 54,900 |
| Meredith Family Fund | 2,600 |
| Michael Chamberlain Fund | 60,000 |
| Mildred Dixon Holmes - Youth Orchestra Fund | 5,640 |
| The Milne McGrath Fund | 43,064 |
| Ray Brillinger & Cy Hack Fund | 6,000 |
| The Ron & Gina Fraser Endowment Fund | 5,489 |
| Rotary Club of Hamilton East-Wentworth Foundation Fund | 5,000 |
| Shirley M. Elford Artist's Fund | 2,600 |
| Sons of Italy Hamilton Trieste Lodge Legacy Fund | 1,000 |
| Tara Lynn Giuliani Foundation | 14,600 |
| Ted & Karin Bossence Fund* | 49 |
| Thorne Family Fund | 5,250 |
| Tran Family Fund* | 3,298 |
| W. L. Carpenter Memorial Fund* | 100,436 |
| Williams Family Fund* | 3,658 |
| The Young Fund* | 1,755,335 |
| TOTAL | 7,100,580 |
| Grants from field-of-interest funds | Amount |
|---|---|
| #HamOntForever Fund | 2,000 |
| Alfred & Joan Robertshaw Memorial Fund | 24,958 |
| The Alice Jean Ainsworth Memorial Fund | 84,551 |
| The Angel Fund* | 6,311 |
| Anonymous | 3,370 |
| Antonina Lombardo Fund | 7,508 |
| Arthur & Helena Lemon Fund | 5,342 |
| Barbara & Bob Harwood Fund | 9,479 |
| Barbara Bethune Fund* | 6,632 |
| Barbara Farnan Fund | 5,000 |
| Betty & Jack George Family Fund | 1,438 |
| Bill & Tina Seale Fund | 16,014 |
| Charles & Ret Swire Fund | 10,553 |
| Delaware Fund | 21,563 |
| Dougher Community Fund | 129,730 |
| Edward & Gladys Halloran Memorial Fund | 40,411 |
| Everard Hambro Fund | 2,282 |
| First Place, Hamilton Tomorrow Fund | 13,008 |
| Florence E.S. Hutton Fund* | 23,688 |
| Foxcroft Family Youth Fund | 1,500 |
| Fund for Underprivileged Children | 32,048 |
| George & Shirley McBride Foundation Fund | 26,909 |
| Gibson Trust/Town of Flamborough | 1,713 |
| Giovanni & Grazia Criminisi Literacy Fund* | 1,780 |
| Hogarth Family Pioneer Energy Fund | 65,000 |
| Ike & Shahnaz Ahmed Foundation Fund | 1,300 |
| Jeanne Scott Fund* | 49,015 |
| Joan C. Watt Memorial Fund | 1,862 |
| Kenneth Boothe Young & Marie Catherine Young Fund | 65,055 |
| Lillian & Marvin Goldblatt Family Fund | 7,339 |
| Lillian M. Shaw Fund | 14,402 |
| Marchese Health Care 50th Anniversary Legacy Fund | 5,466 |
| Mary Lauder Cassidy Fund | 12,800 |
| Nelson Allan Fund | 7,282 |
| Note-Able Music Fund | 3,192 |
| Ontario Endowment for Children & Youth in Recreation Fund | 59,688 |
| Ray Lowes Environmental Fund | 20,810 |
| Royal Canadian Humane Association Fund | 3,621 |
| Russell I. Elman Fund | 65,500 |
| School Nourishment Fund | 99 |
| School Sisters of Notre Dame Legacy Fund | 10,808 |
| Shirley M. Elford Gift of Today Fund | 6,012 |
| Terry & Brenda Yates Fund | 45,000 |
| The Van Dusen Fund* | 40,835 |
| Vera & Percy Tomlinson Fund | 5,267 |
| W. Robert & Marion S. Shivas Conservation Trust Fund | 15,532 |
| Women 4 Change Fund | 55,250 |
| Youth & Philanthropy Fund | 23,236 |
| TOTAL | 1,062,158 |
| Grants from Community Fund | Amount |
|---|---|
| ABACUS | 1,051,945 |
| Community Arts Fund | 200,000 |
| Community Fund: Environment Endowment Fund | 63,250 |
| Community Fund: Arts Endowment Fund | 5,705 |
| Neighbourhoods | 21,000 |
| Other | 470,959 |
| Pandemic Response Fund | 305,000 |
| TOTAL | 2,117,859 |
| Grants by recipient organization S-Z | |
|---|---|
| The Salvation Army Hamilton Booth Centre | |
| Dundas Stride Circles * | 14,000 |
| Environmental Community Opportunities project * | 14,000 |
| Pandemic relief * | 25,000 |
| Populating the Forest * | 7,350 |
| Supporting grant | 6,819 |
| Scientists in School | |
| Hamilton STEM Enrichment | 10,000 |
| Scleroderma Society of Ontario | |
| Supporting grant | 10,000 |
| Supporting grant * | 1,000 |
| Scouts Canada - Central Ontario Service Centre | |
| Supporting grant | 250 |
| Seniors Activities in Southwest Hamilton | |
| Physical and mental health programs * | 5,000 |
| Sexual Assault Centre | |
| Supporting grant | 822 |
| Supporting grant * | 5,000 |
| Shakespearience Performing Arts | |
| School programs | 6,000 |
| Shalem Mental Health Network | |
| Counselling Assistance Fund | 20,000 |
| Shelter Health Network/Canadian Mental Health Association, Hamilton Branch | |
| Pandemic relief * | 10,000 |
| Supporting grant * | 2,500 |
| Sheridan College, Oakville Campus | |
| Music, Theatre, Performance | 500 |
| Shriners Hospitals for Children | |
| Supporting grant | 1,136 |
| Simon Fraser University | |
| John Juliani Memorial Fund | 1,000 |
| Skills for Change | |
| Bridging the Gap * | 17,000 |
| Society of our Lady of the Most Holy Trinity (Canada) | |
| Supporting grant | 39,435 |
| Soroptimist International of Hamilton-Burlington | |
| Live Your Dream | 5,000 |
| St. Jerome's University | |
| Supporting grant | 5,000 |
| St. John Ambulance - Hamilton Branch | |
| Therapy Dog Program * | 8,500 |
| St. Joseph's Healthcare Foundation | |
| Mental health services at West 5th location | 10,000 |
| Supporting grant | 21,000 |
| St. Joseph's Healthcare | |
| Youth Empowerment Fund | 5,000 |
| St. Joseph's Home Care | |
| Supporting grant * | 13,008 |
| St. Joseph's Villa Foundation | |
| Enhancing care * | 5,000 |
| Hospice care | 5,000 |
| Smart Board Resident Engagement * | 20,000 |
| Supporting grant | 35,000 |
| St. Matthew's House | |
| Adopt-a-Family/Seniors’ Christmas Program | 4,000 |
| Pandemic relief * | 10,000 |
| Seniors’ Community Inclusion Project * | 10,000 |
| Seniors’ Drop-In Support Centre * | 750 |
| Supporting grant | 22,845 |
| St. Patrick's Parish | |
| Heritage Fund | 50,000 |
| Supporting grant | 272 |
| St. Paul's Presbyterian Church | |
| Supporting grant | 2,261 |
| St. Raphael's Parish Church | |
| Supporting grant | 6,000 |
| Start2Finish | |
| Junior Coach Leadership Development Program Expansion * | 27,000 |
| Running & Reading Clubs | 13,000 |
| Running & Reading Clubs * | 17,000 |
| The Stop Community Food Centre | |
| Supporting grant | 50,000 |
| Student Open Circles | |
| Community Volunteer Circles | 10,900 |
| Community Volunteer Circles * | 10,000 |
| Supporting grant | 1,603 |
| Supporting grant * | 1,000 |
| Swim, Drink, Fish Canada | |
| Supporting grant | 500 |
| Swimming with a Mission/Special Olympics Ontario Inc. | |
| Swim lessons * | 750 |
| T.E.A.D. Equestrian Association for the Disabled | |
| Therapeutic riding * | 5,099 |
| Tamarack Institute for Community Engagement | |
| Supporting grant | 50,000 |
| Tastebuds / Social Planning & Research Council of Hamilton | |
| Supporting grant * | 99 |
| Telling Tales | |
| Community & School Literacy Outreach Project | 2,000 |
| Community & School Literacy Outreach Project * | 3,000 |
| Dundas Resident Outreach and Engagement * | 3,000 |
| Interactive storytelling for kids and their families * | 8,305 |
| Literacy Outreach Project * | 8,000 |
| Supporting grant | 25,000 |
| Tetra Society of North America | |
| Assistive Device Booster Initiative | 4,000 |
| The Hamilton Burlington SPCA | |
| Care of dogs | 6,000 |
| Sit! Stay! Read! | 1,040 |
| Supporting grant | 115,823 |
| Supporting grant * | 5,267 |
| The LOST Organization | |
| Supporting grant * | 3,211 |
| Women's mental health | 650 |
| The National Ballet of Canada | |
| Supporting grant | 500 |
| Theatre Ancaster | |
| Supporting grant * | 5,000 |
| Theatre Aquarius | |
| Indigenous Arts Project | 2,500 |
| Newcomer Arts Project | 3,000 |
| Ovation Outreach Enrollment Program | 5,000 |
| Pay-what-you-can Preview Series * | 12,500 |
| Supporting grant | 5,000 |
| Threshold School of Building | |
| Job developer | 20,000 |
| Supporting grant | 10,000 |
| Tomorrow's Voices Foundation | |
| Tomorrow's Voices Hamilton | 7,300 |
| Toronto Festival of Arts, Culture and Creativity o/a Luminato | |
| Supporting grant | 300 |
| Toronto Foundation | |
| Pandemic Relief Fund | 50,000 |
| Tottering Biped Theatre Inc. | |
| Shakespeare for at-risk youth * | 10,200 |
| Trinity United Church | |
| Supporting grant | 366,667 |
| TVOntario | |
| Supporting grant | 598 |
| The Tyndale Foundation | |
| Supporting grant | 2,274 |
| United Way Halton & Hamilton | |
| Supporting grant | 20,330 |
| University of Guelph | |
| Lang School of Business & Economics | 10,000 |
| University of Notre Dame | |
| Monogram Fund for Father Scott Giuliani | 200 |
| University of St. Michael's College | |
| Supporting grant | 7,500 |
| University of Toronto | |
| President's Club | 1,000 |
| Urquhart Butterfly Garden/Hamilton Naturalists' Club | |
| Education Program at the Urquhart Butterfly Garden * | 9,170 |
| Victoria Foundation | |
| Green Shield Canada Six 4 Six | 455,000 |
| Victorian Order of Nurses, Hamilton Branch | |
| Meals on Wheels | 6,000 |
| Pediatric palliative homecare | 8,064 |
| Village Theatre (Waterdown) Inc. | |
| Supporting grant * | 5,000 |
| War Amputations of Canada | |
| Supporting gant | 1,500 |
| Welcome Inn Community Centre of Hamilton | |
| Isolated seniors | 650 |
| Learning and Fun * | 2,826 |
| New Horizons Thrift Store * | 10,000 |
| Pandemic relief * | 10,000 |
| Seniors Program Transportation * | 4,150 |
| Supporting grant | 5,570 |
| Supporting grant * | 2,640 |
| Welcome Inn Christmas Celebration | 2,200 |
| Wellwood Resource Centre of Hamilton | |
| Creative Expression | 1,901 |
| Men’s peer support | 6,000 |
| Supporting grant * | 6,012 |
| Alumni Family Days * | 5,000 |
| Wesley Urban Ministries | |
| Academic Success and Leadership Development Program * | 60,000 |
| Nutritious snacks for children | 4,899 |
| Pandemic relief * | 25,000 |
| Supporting grant | 20,704 |
| Women's programming | 4,000 |
| Youth Housing | 50,000 |
| Westdale Cinema Group | |
| Street Combers * | 14,150 |
| Supporting grant | 5,000 |
| This Is Me * | 12,550 |
| Westdale Secondary School/Hamilton Foundation for Student Success | |
| ESL Literacy Promotion * | 3,000 |
| Windmill Microlending | |
| Supporting grant | 50,000 |
| WindsorEssex Community Foundation | |
| Green Shield Canada Six 4 Six | 530,000 |
| Woodland Cultural Centre | |
| Save the Evidence - Give a Brick | 5,000 |
| Woodview Children's Centre | |
| Supporting grant | 1,000 |
| Workers Arts & Heritage Centre | |
| Exhibits Prototype Project * | 10,000 |
| School visits | 1,500 |
| World Society for the Protection of Animals Canada | |
| Support for Australia | 1,000 |
| YMCA of Hamilton/Burlington/Brantford | |
| Beyond the Bell | 40,000 |
| Camp Wanakita - capital project | 3,000 |
| Camp Wanakita - counsellor bursary | 1,000 |
| Camp Wanakita - supporting grant | 1,000 |
| Flamborough Healthy Youth Network | 6,100 |
| Peace Medal Breakfast | 5,000 |
| Youth and Philanthropy Initiative Canada | |
| Supporting grant * | 35,000 |
| Women 4 Change Youth Engagement Awards * | 10,000 |
| YMCA Newcomer Youth Centre * | 5,000 |
| YWCA Hamilton | |
| Community Connection through the arts * | 12,100 |
| Family Access Centre Nutrition Project | 2,500 |
| Food for Thought | 18,000 |
| Good Beginnings * | 15,000 |
| Helping Hands for the Holidays at Phoenix Place | 2,050 |
| Pandemic relief * | 25,000 |
| Transitional Living Program | 8,000 |
| Welcome Home Project | 4,625 |
| YWay@Glendale * | 17,708 |
| Grants by recipient organization E-H | |
|---|---|
| Elizabeth Bagshaw School/Hamilton Foundation for Student Success | |
| Bagshaw Bengals Build For Better! * | 5,000 |
| Elizabeth Fry Society | |
| Release planning/anti-theft programming * | 30,000 |
| Pandemic relief * | 5,000 |
| Seasonal outreach | 3,500 |
| Elliott Heights Baptist Church | |
| LARCH After-school Program | 31,540 |
| LARCH After-school Program * | 51,146 |
| Empowerment Squared | |
| Academic Mentoring Program * | 165,000 |
| Engineers Without Borders (Canada) | |
| Supporting grant | 75,000 |
| The Equality Effect | |
| Supporting grant | 75,000 |
| Essential Aid and Family Services of Ontario Inc. | |
| Pandemic relief * | 10,000 |
| Eva Rothwell Centre | |
| After-school Program | 12,000 |
| After-school Program* | 16,232 |
| Robert Land Community food and breakfast programs | 10,000 |
| Supporting grant | 8,000 |
| Evergreen | |
| Supporting grant | 55,000 |
| Famille Marie-Jeunesse Sherbrooke | |
| Supporting grant | 2,000 |
| Fit Active Beautiful (FAB) Foundation | |
| FAB Girls 5K Challenge * | 5,000 |
| FAB Girls 5K Challenge and FAB Girls Empowerment Program | 3,000 |
| Fondation Rideau Hall Foundation | |
| Post-Secondary Access and Success Network * | 50,000 |
| Food Banks Canada | |
| Supporting grant | 50,000 |
| Food4Kids Hamilton Halton Niagara | |
| Supporting grant | 5,000 |
| Weekends Without Hunger * | 5,000 |
| Foundation for Advancing Family Medicine | |
| Supporting grant | 5,000 |
| Frank Panabaker Public School/Hamilton Foundation for Student Success | |
| Stream of Dreams * | 4,250 |
| Georgian Bay Forever | |
| Supporting grant | 5,000 |
| Good Shepherd Centres Hamilton | |
| Pandemic relief * | 25,000 |
| Regina's Place and The Jeanne Scott Parent & Child Resource Centre * | 15,000 |
| Regina's Place | 20,000 |
| Regina's Place * | 10,808 |
| Stimulation Activation Motivation * | 19,341 |
| Subsidized housing | 20,000 |
| Supporting grant | 64,106 |
| Supporting grant * | 12,255 |
| Trauma Informed Yoga | 4,500 |
| Youth Reconnect | 30,000 |
| Greater Hamilton Symphony Association | |
| Supporting grant | 600 |
| Green Cities Foundation | |
| Hamilton Barton Village Green My City * | 10,000 |
| Green Venture/Conserver Society of Hamilton & District, Inc. | |
| Green Infrastructure in Dundas: A Cycle Garden Tour * | 5,000 |
| Nature Ninjas | 1,500 |
| /EduDeo Ministries | |
| Depave Paradise on Barton * | 8,000 |
| /Trees for Hamilton | |
| Canopy for Community * | 17,581 |
| Habitat for Humanity Hamilton | |
| Indigenous Housing Partnership | 2,000 |
| Haldimand Bird Observatory | |
| Mist nets | 3,250 |
| Halton Women's Place | |
| Supporting grant | 2,926 |
| Hamilton Academy of Performing Arts | |
| Nutcracker ticket subsidies * | 5,000 |
| Hamilton All Star Jazz Band | |
| Supporting grant | 2,000 |
| Hamilton Artists Inc. | |
| Public programs and outreach * | 10,000 |
| Hamilton Basketball Association/Hamilton Foundation for Student Success | |
| Supporting grant | 22,000 |
| Hamilton Centre for Civic Inclusion | |
| Hamilton Community Benefits Network * | 3,000 |
| Hamilton Children's Choir | |
| After-school Choir * | 10,400 |
| Supporting grant | 5,000 |
| Hamilton Community Legal Clinic | |
| Hamilton Roundtable for Poverty Reduction * | 50,150 |
| No Hate in the Hammer * | 2,000 |
| Pandemic relief * | 10,000 |
| Hamilton Conservation Authority | |
| Supporting grant * | 10,405 |
| Hamilton Conservation Foundation | |
| EcoCise * | 12,400 |
| Outdoor Environmental Education in Dundas Valley Conservation Area | 13,500 |
| Outdoor Environmental Education in Dundas Valley Conservation Area* | 5,000 |
| Supporting grant | 1,000 |
| Supporting grant * | 3,883 |
| Hamilton Conservatory for the Arts Dance Theatre | |
| Imprint: Hamilton * | 10,000 |
| Hamilton District Society for Disabled Children | |
| Supporting grant | 658 |
| Hamilton East Kiwanis Boys' and Girls' Club | |
| ABACUS at Kiwanis * | 150,000 |
| Act Out * | 20,000 |
| Be Kind Rewind * | 20,000 |
| Brighter Futures | 2,000 |
| On the Move Girls * | 6,000 |
| Raising Our Children’s Kids | 6,000 |
| Sherman Club Community Arts Program | 15,000 |
| Woodland * | 15,000 |
| Hamilton East Kiwanis Non-Profit Homes Inc. | |
| South Mountain Support Group * | 500 |
| Hamilton Festival Theatre Company | |
| Equity Initiative * | 15,000 |
| Hamilton Food Share | |
| Baby and culturally specific foods | 4,000 |
| Infant products | 2,000 |
| Pandemic relief * | 50,000 |
| Supporting grant | 151,600 |
| Supporting grant * | 34,168 |
| Hamilton Foundation for Student Success | |
| Bernie Custis Secondary School - YMCA Camp Wanakita | 10,725 |
| Rainbow Prom | 500 |
| Rainbow Prom* | 2,000 |
| Safe Schools: Bullying Prevention and Intervention Review Panel * | 50,000 |
| Skills Competition and Transition Trailer * | 20,000 |
| Teacher Small Grants * | 14,690 |
| Hamilton Health Sciences Corporation | |
| Summer Internship program | 7,381 |
| Hamilton Health Sciences Foundation | |
| Hamilton General Hospital Stroke Unit | 10,000 |
| Hybrid Operating Room Project | 16,763 |
| McMaster Children's Hospital Foundation Medical Equipment | 786 |
| Supporting grant | 4,500 |
| W. Leonard and Phyllis Carpenter Memorial Endowment Fund | 10,000 |
| Hamilton Jewish Federation | |
| Holocaust education * | 10,000 |
| Hamilton Jewish Social Services | |
| Nourishment 4 Seniors * | 10,000 |
| Zichronot * | 4,500 |
| Hamilton Music Collective | |
| An Instrument for Every Child | 13,043 |
| Collaboration and programming expansion | 10,000 |
| Mental Wellness Through Music | 2,000 |
| Supporting grant | 600 |
| Hamilton Naturalists' Club | |
| Grimsby Wetlands Project | 2,000 |
| Hess Street School Bioblitz at Amaolo Sanctuary | 2,000 |
| Invasive species management at Amaolo Nature Sanctuary | 2,500 |
| Sanctuary Land Trust | 7,500 |
| Supporting grant | 2,500 |
| Supporting grant * | 14,288 |
| Trees Please * | 5,000 |
| Urquhart Butterfly Garden and projector | 1,874 |
| Hamilton Philharmonic Orchestra (2000) Inc. | |
| Children and seniors programming | 13,600 |
| Children and seniors programming * | 10,000 |
| Endowment Fund | 11,000 |
| Mozart & Mendelsohn concert | 10,000 |
| Outreach program | 5,000 |
| Supporting grant | 44,471 |
| Symphony experience for seniors * | 5,000 |
| Hamilton Philharmonic Youth Orchestra | |
| Supporting grant | 2,000 |
| Hamilton Regional Indian Centre | |
| Strengthening Hamilton's Aboriginal Education | 20,000 |
| Hamilton Right to Life | |
| Supporting grant | 5,000 |
| Hamilton Roundtable for Poverty Reduction / Hamilton Community Legal Clinic | |
| Basic Income Research Project * | 3,000 |
| Hamilton Social Medicine Response Team/The AIDS Network | |
| Pandemic relief * | 10,000 |
| Hamilton Sustainable Victory Gardens Inc. | |
| Supporting grant | 2,000 |
| Hamilton-Wentworth Catholic District School Board | |
| Bike for Mike KoBi program | 60,000 |
| Equal Opportunities Fund | 272 |
| L.E.A.D. Intergenerational Play at Seniors’ Homes * | 12,500 |
| L.E.A.D. Successful Transitions Project * | 50,000 |
| Teacher Small Grants * | 12,201 |
| Hamilton Youth Poets/Lynwood Charlton Centre | |
| Brave Voices | 13,000 |
| /Hamilton Foundation for Student Success | |
| Junior Poetics * | 180,000 |
| Harlequin Singers of Hamilton | |
| Live Concert Series | 3,500 |
| Healing Arts and Recovery with Peer Support/The John Howard Society | |
| Supporting grant and tenant engagement * | 15,000 |
| Heart and Stroke Foundation of Ontario | |
| Supporting grant | 2,134 |
| Hearts Together For Haiti | |
| Supporting grant | 7,500 |
| Hillcrest Elementary School/Hamilton Foundation for Student Success | |
| Engaging and Promoting Inquisitive Minds | 5,000 |
| The Hospital for Sick Children | |
| Supporting grant | 2,525 |
| Grants by recipient organization A-D | Amount |
|---|---|
| 735 Firebird Squadron Royal Canadian Air Cadets | |
| Putting the Air in Air Cadets * | 3,118 |
| A Rocha Canada | |
| Operation Wild Teams * | 19,000 |
| ACORN Institute Canada | |
| Civic Connections Expansion Project * | 25,000 |
| Actors Fund of Canada | |
| Supporting grant | 500 |
| Adult Basic Education Association | |
| Educational Planning Services | 10,560 |
| Advocacy Centre for the Elderly | |
| Supporting grant * | 1,870 |
| Alzheimer Society of Hamilton and Halton | |
| Creative Expressions * | 11,500 |
| Music 4 Memories * | 7,508 |
| Ancaster Community Services & Information | |
| Youth Empowerment Program * | 15,000 |
| Ancaster Society for the Performing Arts Corporation | |
| Sinfonia Ancaster | 3,000 |
| Art Gallery of Burlington | |
| Supporting grant | 500 |
| Art Gallery of Hamilton | |
| AGH: In-Class | 10,000 |
| AGH: In-Class * | 94,020 |
| Children's programs | 2,500 |
| Supporting grant | 7,000 |
| Art Gallery of Ontario | |
| Business for the Arts | 500 |
| Supporting grant | 2,000 |
| Art With Impact Canada | |
| Art, media, mental health | 4,000 |
| The Arthritis Society | |
| Supporting grant | 2,274 |
| Artscape Foundation | |
| Supporting grant | 50,000 |
| ASHOKA Canada | |
| Supporting grant | 50,000 |
| Autism Society of Ontario, Hamilton Chapter | |
| Getting into the Game in Hamilton * | 3,000 |
| Respite programs/services for caregivers | 500 |
| Support for adults * | 5,000 |
| Bach Elgar Choir | |
| Supporting grant | 2,000 |
| Bay Area Restoration Council | |
| Supporting grant | 432 |
| Beautiful Alleys/Hamilton East Kiwanis Non-Profit Homes Inc. | |
| Birge Street Parkette * | 10,000 |
| Bernie Custis Secondary School/Hamilton Foundation for Student Success | |
| Cultural Fair and Carnival | 500 |
| Planet Friendly Forever | 1,000 |
| SLAM Poetry Team | 1,700 |
| Student Action Against Bullying | 5,000 |
| Bill Seven Award Trust | |
| Supporting grant | 6,000 |
| Bird Studies Canada | |
| Supporting grant | 2,312 |
| Birthright Organization of Hamilton | |
| Supporting grant | 7,000 |
| Brant Food for Thought | |
| Universal Student Nutrition Program | 3,000 |
| The Bridge from Prison to Community (Hamilton) | |
| Supporting grant | 5,000 |
| Brott Music Festival | |
| Education for Peace music concerts | 3,000 |
| Bruce Trail Conservancy | |
| Supporting grant | 3,530 |
| Burlington Civic Chorale | |
| Supporting grant | 5,000 |
| Burlington Community Foundation | |
| Supporting grant * | 24,756 |
| Burlington Performing Arts Centre | |
| Supporting grant | 1,100 |
| Bursary of Hope for Autism | |
| Supporting grant | 5,000 |
| Canadian Arabic Orchestra | |
| Hamilton programming * | 10,000 |
| Canadian Cancer Society, Ontario Division | |
| Supporting grant | 4,129 |
| Canadian Catholic Organization for Development and Peace | |
| Supporting grant | 400 |
| Canadian Cystic Fibrosis Foundation | |
| Supporting grant | 2,274 |
| Canadian Institute for Advanced Research | |
| Supporting grant | 50,000 |
| Canadian Mental Health Association, York Region Branch | |
| Workplace and Community Mental Health | 150,000 |
| Canadian Mental Health Association, Hamilton Branch | |
| Evening Social Recreation Rehabilitation Program * | 6,000 |
| Canadian Opera Company | |
| Supporting grant | 500 |
| The Canadian Red Cross Society | |
| Supporting grant | 619 |
| Tiffany Circle | 20,000 |
| The Canadian Stage Corporation | |
| Supporting grant | 300 |
| Canadian Warplane Heritage Museum | |
| Education & Kids Camp Program | 10,000 |
| Cancer Assistance Program City of Hamilton & District | |
| Drive & Ride | 15,000 |
| Personal Care and Nutritional Supports | 4,000 |
| Capitol Theatre Heritage Foundation | |
| Children and youth programming | 5,000 |
| Carpenter Hospice | |
| Care Beyond our Walls | 20,000 |
| Supporting grant | 1,000 |
| Casey House Foundation | |
| Capital campaign | 25,000 |
| Leaders' Circle | 5,000 |
| Catholic Family Services of Hamilton | |
| St. Martin's Manor | 2,000 |
| Catholic Youth Organization | |
| Supporting grant | 543 |
| Central Presbyterian Church | |
| Supporting grant | 11,748 |
| Chamber Music Hamilton | |
| Supporting grant | 14,000 |
| Children's Aid Society of Hamilton | |
| Post-secondary bursaries and summer camperships | 13,000 |
| Summer camperships * | 7,315 |
| Supporting grant | 1,000 |
| Christian Horizons Canada | |
| Supporting grant | 2,274 |
| Christ's Church Cathedral | |
| Supporting grant | 2,000 |
| City Kidz Ministry | |
| CityYouth Leadership Development | 5,000 |
| Supporting grant | 20,000 |
| City of Hamilton | |
| McQuesten Urban Farm | 121,875 |
| Neighbourhood small grants program | 20,000 |
| Nurse Family Partnership | 41,000 |
| Senior isolation reduction initiatives * | 16,250 |
| Shirley Elford Emerging Artist Prize | 2,600 |
| Xperience Annex - Youth in Construction | 5,489 |
| Xperience Annex - Youth in Construction * | 52,500 |
| CivicAction Leadership Foundation | |
| Supporting grant | 250 |
| Coady International Institute-St. Francis Xavier University | |
| Supporting grant | 25,000 |
| The Colin B. Glassco Charitable Foundation for Children | |
| Supporting grant | 85,000 |
| Community Care of West Niagara | |
| Supporting grant | 5,000 |
| Community Development Halton | |
| Supporting grant | 20,000 |
| Community Food Centres Canada | |
| Supporting grant | 100,000 |
| Community Foundation Grey Bruce | |
| Supporting grant * | 11,820 |
| Community Foundation of Nova Scotia | |
| Green Shield Canada Six 4 Six | 570,000 |
| Community Foundations of Canada | |
| Green Shield Canada Six 4 Six | 75,000 |
| Supporting grant * | 43,931 |
| Community Living Hamilton | |
| Supporting grant | 310 |
| Compass Community Health | |
| Cooking with Compass * | 20,000 |
| PATH Program * | 179,160 |
| Pathways to Education - post-secondary scholarships | 20,000 |
| Pathways to Education - sports and recreation access program * | 6,500 |
| Pathways to Education - youth mental health worker program | 25,000 |
| Compass Point Bible Church | |
| 541 Eatery & Exchange * | 1,000 |
| Conservation Halton | |
| Supporting grant * | 3,883 |
| Conserver Society of Hamilton & District, Inc. | |
| Dundas Turtle Watch and projector | 1,054 |
| Covenant House Toronto | |
| Supporting grant | 598 |
| Culture for Kids in the Arts | |
| After-school Arts Program | 20,000 |
| All Arts Access * | 10,000 |
| Artasia: Glocal | 1,500 |
| Artasia: Glocal * | 35,460 |
| Resonance Choir | 4,000 |
| Culture of Peace Hamilton/United Nations Association in Canada, Hamilton Branch | |
| Supporting grant | 1,265 |
| Dave Andreychuk Foundation | |
| Mount Hamilton Minor Hockey | 544 |
| Dave Thomas Foundation for Adoption | |
| Supporting grant | 1,000 |
| Wendy's Wonderful Kids | 75,000 |
| De Dwa Da Dehs Nye>S Aboriginal Health Centre | |
| Pandemic relief * | 25,000 |
| De Mazenod Door Outreach | |
| Supporting grant * | 5,000 |
| Delta United Church | |
| Supporting grant | 14,000 |
| Diabetes Canada | |
| Children’s health education | 2,000 |
| Dr. Bob Kemp Hospice Foundation | |
| Camp Keaton Hamilton | 10,500 |
| Supporting grant | 42,860 |
| Dundas Art and Craft Association | |
| Carnegie Kids * | 5,303 |
| Dundas Baptist Church | |
| The Connect Theatre Project * | 6,000 |
| Dundas Historical Society Museum | |
| Community and family engagement * | 5,000 |
| Supporting grant | 2,000 |
| Dundas Turtle Watch/Conserver Society of Hamilton & District, Inc. | |
| Protect Our Native Turtles * | 3,439 |
| Dundas Valley Orchestra | |
| Orchestral concert * | 5,000 |
| Supporting grant | 1,000 |
| Dundas Valley School of Art | |
| Aging Artfully * | 15,000 |
| Art Accessibility Program - Family Art Days * | 10,000 |
| Art Accessibility Program - Foster the Ability Bursary Program | 3,000 |
| Bursary program * | 2,282 |
| Piece by Piece * | 15,000 |
| The Artists' Connection | 12,000 |
| Dundas Youth Chaplaincy | |
| Routes Youth Centre | 15,000 |
| Routes Youth Centre * | 22,000 |
Hamilton Community Foundation’s work is supported by both standing committees of the Board of Directors and board advisory committees. Membership of the board advisory committees includes both board members and a wide range of community volunteers whose expertise we rely on and appreciate. Standing committees of the board include: Governance & Board Effectiveness, Finance & Investment, and the Impact Investment Committee.
Audit Committee
Chaney-Ensign Bursary Fund
Community Fund
Community Health, Education and Research Fund
Edith H. Turner Foundation Fund
Finance & Investment Committee
Hamilton Spectator Summer Camp Fund
Impact Investment Committee
McCallum, McBride Fund Advisory Committee
Nomination Committee
Ontario Endowment for Children & Youth in Recreation
as at March 31, 2020
Terry Cooke
President & CEO
Jill Anderson
Director, Philanthropic Services
Annette Aquin, CPA, CA
Executive Vice-President, Finance & Operations
Sharon Charters
Manager, Grants
Grace Diffey, APR, FCPRS
Vice-President, Community Relations
Allan Enriquez
Administrator, Philanthropic Services
Sarah Glen
Manager, Community Initiatives
Matt Goodman
Vice-President, Grants & Community Initiatives
Lisa Habisreutinger
Philanthropic Services Officer
Morag Halsey
Receptionist/Foundation Support Assistant
Tami Henderson
Administrative Assistant, Grants
Jake How
Accountant
Melissa Klaver
Corporate Secretary/Executive Assistant, President & CEO
Angel Li
Senior Accountant
Shylah MacIntyre
Senior Philanthropic Services Officer
Sheree Meredith
Advisor, Philanthropic Services
Michael Parente
Communications Specialist
Jen Pearson
ABACUS Project Manager
Katherine Roy
Scholarship and Bursary Project Lead
Lorraine Valmadrid
Learning & Evaluation Lead
Tracy Varcoe
Administrative Assistant/Webmaster, Community Relations
Yulena Wan, CPA, CA
Manager, Corporate Services
Yvonne Yeoh
Executive Assistant, Finance & Operations
Bob Savage
VP, Manufacturing, ArcelorMittal Dofasco (retired)
Board Chair
Teresa Smith
President, Hamilton General Hospital (retired)
Past Chair
Dr. Maroussia Ahmed
Professor Emeritus, Dept. of French, McMaster University
Laura Cattari
Advocate, Community Engagement and Media
Dr. Juliet Daniel
Professor, Department of Biology, McMaster University
Brooke Eady, CHRP
President, Broadcast Services International
Sandra Edrupt
General Manager, Strategy & Business Planning, ArcelorMittal Dofasco (retired)
Dr. Bill Evans
Professor Emeritus, Dept. of Oncology, McMaster University
President, Oncosynthesis Consulting Inc.
Assad Hoosein
Manager of Facilities, Hamilton Public Library
Milé Komlen
Managing Director, Ethical Associates Inc.
Sarah Murphy, B.Eng, CIM
Investment Advisor/Portfolio Manager, CIBC Wood Gundy
Mario Paron, CPA, CA, CPA (Illinois)*
Canadian Managing Partner, KPMG Enterprise
*resigned from the Board December 2019
Kathy Watts
Vice-President Finance & CFO, Hamilton Health Sciences (retired)
Marita Zaffiro, BScPhm, MBA
President & CEO, Marchese Health Care
Terry Cooke
President & CEO
Secretary of the Board
Lorem ipsum dolor sit amet, consectetur adipiscing elit. Mauris id sollicitudin eros.
| Grants by recipient organization | |
|---|---|
| 735 Firebird Squadron Royal Canadian Air Cadets | |
| Putting the Air in Air Cadets* | 4,650 |
| ACORN Institute Canada | |
| Tenant education workshops* | 5,000 |
| Adult Basic Education Association | |
| Educational planning services | 9,000 |
| The AIDS Network | |
| Queer and Trans Youth Collaborative* | 30,000 |
| Alzheimer Society of Hamilton and Halton | |
| Music 4 Memories* | 8,000 |
| Ancaster Community Services & Information | |
| Youth empowerment* | 15,000 |
| Ancaster Society for the Performing Arts Corporation | |
| Music at Fieldcote | 1,000 |
| Supporting grant | 3,000 |
| Art Gallery of Burlington | |
| Supporting grant | 500 |
| Art Gallery of Hamilton | |
| AGH: In-Class | 10,000 |
| AGH: In-Class* | 89,500 |
| Children's programs | 5,000 |
| Hamilton Community Benefits Network | 2,800 |
| Hamilton Community Benefits Network* | 2,200 |
| Supporting grant | 9,000 |
| Art Gallery of Ontario | |
| Business for the Arts | 500 |
| Supporting grant | 2,000 |
| The Arthritis Society | |
| Supporting grant | 2,336 |
| Artscape Foundation | |
| Supporting grant | 50,000 |
| ASHOKA Canada | |
| Supporting grant | 50,000 |
| Astra Society of Hamilton & District | |
| Neighbourhood small grants* | 600 |
| Autism Society of Ontario, Hamilton Chapter | |
| Caregiver respite | 500 |
| Bach Elgar Choir | |
| Beethoven Mass in C Major | 3,000 |
| Supporting grant | 4,000 |
| Bennetto Middle School/Hamilton Foundation for Student Success | |
| Supporting grant | 2,198 |
| Big Brothers Big Sisters of Hamilton & Burlington | |
| In-school mentoring | 10,000 |
| One-to-one mentors* | 10,000 |
| Bird Studies Canada | |
| Supporting grant | 1,751 |
| Birthright Organization of Hamilton | |
| Supporting grant | 5,000 |
| Brant Food for Thought | |
| Food security | 5,000 |
| The Bridge from Prison to Community (Hamilton) | |
| Supporting grant | 5,000 |
| Bruce Trail Conservancy | |
| Driftwood Cove, Tobermory property purchase | 500,000 |
| Fisher's Pond | 1,500 |
| Hamilton Region Trail Access Project | 4,000 |
| Supporting grant | 2,926 |
| Burlington Civic Chorale | |
| Supporting grant | 5,500 |
| Burlington Community Foundation | |
| Supporting grant* | 24,016 |
| Burlington Performing Arts Centre | |
| Supporting grant | 300 |
| The Calgary Foundation | |
| Green Shield Canada Six 4 Six | 980,000 |
| Cambridge Self-Help Food Bank | |
| Supporting grant | 5,000 |
| Canadian Cancer Society, Ontario Division | |
| Supporting grant | 1,673 |
| Canadian Cystic Fibrosis Foundation | |
| Supporting grant | 2,336 |
| Canadian Institute for Advanced Research | |
| Supporting grant | 50,000 |
| Canadian Mental Health Association | |
| Peer support training for safe injection site* | 12,000 |
| Canadian National Institute for the Blind | |
| Lake Joseph Centre | 250,000 |
| Youth Empowerment | 10,000 |
| Canadian Opera Company | |
| Supporting grant | 500 |
| The Canadian Red Cross Society | |
| Supporting grant | 636 |
| Tiffany Circle | 10,000 |
| The Canadian Stage Corporation | |
| Supporting grant | 300 |
| Canadian Warplane Heritage Museum | |
| Children's programs | 2,500 |
| Cancer Assistance Program City of Hamilton & District | |
| Educational podcasts | 2,000 |
| Personal care and nutrition program | 3,000 |
| Personal care products* | 5,000 |
| Carpenter Hospice | |
| Making Room capital campaign | 25,000 |
| Supporting grant | 500 |
| Catholic Children's Aid Society of Hamilton | |
| One-to-one support at home* | 10,000 |
| Catholic Youth Organization | |
| Supporting grant | 541 |
| Central Presbyterian Church | |
| Supporting grant | 11,850 |
| Centre3 for Print and Media Arts | |
| Art [2] Enrich | 25,000 |
| Hatts Off open arts* | 5,000 |
| Chamber Music Hamilton | |
| Supporting grant | 13,000 |
| Children's Aid Society of Hamilton | |
| Bursaries and camperships | 13,000 |
| Miller Bear Program | 3,000 |
| Supporting grant | 1,000 |
| Christian Horizons Canada | |
| Supporting grant | 2,336 |
| Christ's Church Cathedral | |
| Supporting grant | 2,000 |
| City Housing Hamilton | |
| Sherwood Place Christmas Dinner | 220 |
| Vanier Towers Photovoice* | 2,747 |
| City Kidz Ministry | |
| CityYouth leadership development | 5,000 |
| Gift of Christmas | 1,000 |
| Supporting grant | 20,000 |
| City of Hamilton | |
| Bernie Morelli Recreation Centre program subsidies | 5,000 |
| Green Shield Canada Six 4 Six | 245,344 |
| McQuesten Urban Farm | 184,375 |
| Nurse Family Partnership | 41,000 |
| Shirley Elford Emerging Artist Prize | 2,300 |
| CIVIX | |
| Supporting grant | 50,000 |
| Coady International Institute-St. Francis Xavier University | |
| Supporting grant | 25,000 |
| The Colin B. Glassco Charitable Foundation for Children | |
| Supporting grant | 75,000 |
| Community Care of West Niagara | |
| Supporting grant | 10,000 |
| Community Development Halton | |
| Supporting grant | 20,000 |
| Community Food Centres Canada | |
| Supporting grant | 50,000 |
| Community Foundation Grey Bruce | |
| Supporting grant* | 12,143 |
| Community Foundation of Nova Scotia | |
| Green Shield Canada Six 4 Six | 405,000 |
| Community Foundations of Canada | |
| Consolidated Investment Exploration* | 5,000 |
| Green Shield Canada Six 4 Six | 75,000 |
| Supporting grant* | 39,221 |
| Community Living Hamilton | |
| Supporting grant | 318 |
| Community Resource and Employment Service | |
| Brantford food bank | 10,000 |
| Conservation Halton | |
| Supporting grant* | 3,988 |
| Covenant House Toronto | |
| Supporting grant | 438 |
| Culture for Kids in the Arts | |
| After-school Arts Program | 30,000 |
| Glocal #HereWeArt* | 3,000 |
| Resonance Choir* | 13,630 |
| Culture of Peace Hamilton/United Nations Association in Canada Hamilton Branch | |
| Supporting grant | 1,256 |
| The Dave Andreychuk Foundation | |
| Mount Hamilton Minor Hockey | 541 |
| Disability Justice Network of Ontario/Hamilton Centre for Civic Inclusion | |
| Inaccessible health system research* | 7,800 |
| Doctors Without Borders | |
| Supporting grant | 1,000 |
| Down Syndrome Association of Hamilton | |
| Nurture the Ability Art Workshop* | 5,000 |
| Supporting grant | 700 |
| Dr. Bob Kemp Hospice Foundation | |
| Camp Erin Hamilton | 12,000 |
| Supporting grant | 43,655 |
| Duet Club of Hamilton | |
| Supporting grant | 1,500 |
| Dundas Art and Craft Association | |
| Carnegie Kids* | 4,850 |
| Dundas Baptist Church | |
| The Connect Theatre Project* | 6,000 |
| Dundas Community Services | |
| Volunteer database software* | 4,195 |
| Dundas Historical Society Museum | |
| Community and family engagement* | 7,000 |
| Supporting grant | 2,000 |
| Dundas Turtle Watch/Conserver Society of Hamilton & District, Inc. | |
| Protect our turtles* | 3,210 |
| Dundas Valley Orchestra | |
| Concerts* | 5,000 |
| Dundas Valley School of Art | |
| Ageing Artfully | 3,000 |
| Family Art Days* | 15,000 |
| Foster the Ability | 20,000 |
| Holiday gift workshops | 2,000 |
| Supporting grant | 4,000 |
| Dundas Youth Chaplaincy | |
| Routes Youth Centre | 13,000 |
| Routes Youth Centre* | 20,000 |
| Eagle Worldwide Community Enrichment | |
| Come to the Table* | 5,000 |
| Elizabeth Fry Society | |
| Seasonal outreach | 3,500 |
| Supporting grant | 3,000 |
| Elliott Heights Baptist Church | |
| LARCH After-school Program | 31,520 |
| LARCH After-school Program* | 15,000 |
| Empowerment Squared | |
| African Youth Governance Conference | 6,000 |
| Homework Circle* | 37,500 |
| Summer literacy* | 9,820 |
| Engineers Without Borders (Canada) | |
| Supporting grant | 75,000 |
| Environment Hamilton/Conserver Society of Hamilton & District, Inc. | |
| Friendly Streets Hamilton* | 45,605 |
| Friendly Streets Hamilton hospital zone study* | 11,788 |
| Youth Leaders Eco-Summit* | 3,463 |
| The Equality Effect | |
| Supporting grant | 75,000 |
| Essential Aid and Family Services of Ontario Inc. | |
| Baby related items* | 7,500 |
| Eva Rothwell Centre | |
| Hamilton Imagination Library | 5,000 |
| Hamilton Imagination Library* | 6,500 |
| Neighbourhood small grants* | 597 |
| Robert Land Community Association food and breakfast programs | 5,000 |
| Evergreen | |
| Supporting grant | 50,000 |
| Fit Active Beautiful (FAB) Foundation | |
| FAB Girls 5K Challenge | 7,500 |
| FAB Girls 5K Challenge* | 5,000 |
| Prince of Wales / Bernie Morelli Recreation Centre sites | 11,000 |
| Flamborough Food Bank | |
| Supporting grant | 5,000 |
| Flamborough Information & Community Services | |
| Flamborough Connects | 5,000 |
| Hamilton Rural Seniors Grocery Bus Project | 14,109 |
| Food4Kids Hamilton Halton Niagara | |
| High School Initiative | 5,000 |
| Ready To Learn!* | 6,965 |
| Foundation for Advancing Family Medicine | |
| C. Robert Kemp Grant Awards | 5,000 |
| Good Shepherd Centres Hamilton | |
| Regina's Place/Jeanne Scott Parent and Child Resource Centre* | 12,041 |
| Supporting grant | 46,100 |
| Supporting grant* | 13,633 |
| Greater Hamilton Symphony Association | |
| Supporting grant | 600 |
| Green Venture/Conserver Society of Hamilton & District, Inc. | |
| Depave Paradise at Yorkview* | 8,526 |
| Habitat for Humanity Brant | |
| Supporting grant | 1,000 |
| Habitat for Humanity Canada | |
| Indigenous Housing Partnership | 1,000 |
| Halton Children's Aid Society | |
| Pace Performance Bikes for Kids Program | 2,000 |
| Halton Women's Place | |
| Supporting grant | 2,887 |
| Hamilton & District Extend-a-Family | |
| After-school Homework Club | 10,000 |
| Holiday party | 2,000 |
| Hamilton All Star Jazz Band | |
| Supporting grant | 2,000 |
| Hamilton Association for Residential & Recreational Redevelopment Programs | |
| Neighbourhood small grants* | 4,000 |
| St. Peter's HARRRP | 10,000 |
| Hamilton Basic Income Group/Hamilton Community Legal Clinic | |
| Basic Income Education and Awareness Program | 7,000 |
| Hamilton Bulldogs Foundation Inc. | |
| Breakfast program* | 250 |
| The Hamilton/Burlington SPCA | |
| Dog care | 5,000 |
| Sit! Stay! Read! | 1,020 |
| Supporting grant | 97,705 |
| Supporting grant* | 5,180 |
| Hamilton Children's Choir | |
| Supporting grant | 5,000 |
| Hamilton Conservation Authority | |
| Supporting grant* | 10,701 |
| Hamilton Conservation Foundation | |
| Outdoor Environment Education Program | 13,500 |
| Outdoor Environment Education Program* | 10,000 |
| Supporting grant | 1,000 |
| Supporting grant* | 3,988 |
| Hamilton District Society for Disabled Children | |
| Supporting grant | 674 |
| The Hamilton Dream Centre | |
| Supporting grant | 7,000 |
| Hamilton East Kiwanis Boys' and Girls' Club | |
| Crown Point Educational Engagement* | 45,000 |
| Kaleidoscope programs | 500 |
| Ontario Early Years Centre | 2,000 |
| Programming for girls | 4,000 |
| Skates for youth and families | 10,000 |
| Supporting grant | 2,000 |
| We ROCK summer camperships | 5,000 |
| Youth leadership subsidies* | 3,000 |
| Hamilton East Kiwanis Non-Profit Homes Inc. | |
| Neighbourhood small grants* | 4,035 |
| Hamilton Festival Theatre Company | |
| Artistic Leadership and Entrepreneurial Training Program | 10,000 |
| Hamilton Food Share | |
| Supporting grant | 55,000 |
| Supporting grant* | 12,500 |
| Hamilton Foundation for Student Success | |
| Mount Hope Elementary School Library Revitalization Project* | 10,000 |
| NYA:WEH 2.0* | 60,000 |
| Rainbow Prom | 500 |
| Rainbow Prom* | 2,000 |
| Red Maple reading program* | 19,200 |
| Student Support Grant Project | 5,000 |
| Teacher Small Grants* | 19,250 |
| Hamilton Health Sciences Corporation | |
| Internship program | 7,381 |
| Hamilton Health Sciences Foundation | |
| Cardiac Care at Hamilton General Hospital | 2,500 |
| Dr. Frank Smith | 500 |
| Hybrid Operating Room | 16,763 |
| Supporting grant | 3,500 |
| W. Leonard and Phyllis Carpenter Memorial Endowment Fund | 50,000 |
| Hamilton Literacy Council | |
| Supporting grant | 1,900 |
| Hamilton Mennonite Church | |
| Neighbourhood small grants* | 1,000 |
| Hamilton Music Collective | |
| An Instrument for Every Child | 21,141 |
| Grade 1 trips to McMaster LIVELab | 3,000 |
| Partnership with Hamilton East Kiwanis Boys' and Girls' Club | 20,000 |
| Supporting grant | 5,000 |
| Hamilton Naturalists' Club | |
| Biodiversity in the Schoolyard | 7,000 |
| Connecting students to nature at school* | 7,960 |
| Discover & Restore Nature with Hess Street School | 2,000 |
| Supporting grant | 1,500 |
| Supporting grant* | 14,689 |
| Hamilton Out of the Cold Program Coalition Inc. | |
| Supporting grant | 2,000 |
| Hamilton Philharmonic Orchestra (2000) Inc. | |
| Adopt-a-School | 4,000 |
| Dundas programming* | 11,500 |
| Family and seniors programming | 10,000 |
| Outreach program | 5,000 |
| Supporting grant & Beethoven, Brahms concert | 68,828 |
| Hamilton Philharmonic Youth Orchestra | |
| Supporting grant | 7,653 |
| Hamilton Right to Life | |
| Supporting grant | 5,000 |
| Hamilton Roundtable for Poverty Reduction/Hamilton Community Legal Clinic | |
| Basic Income Speakers Bureau* | 1,700 |
| ODSP Clinics* | 800 |
| Supporting grant | 10,452 |
| Supporting grant* | 50,000 |
| Hamilton Social Medicine Response Team/The AIDS Network | |
| Peer Support Worker Program | 34,008 |
| Hamilton Sustainable Victory Gardens Inc. | |
| Supporting grant | 2,000 |
| Hamilton Theatre Inc. | |
| Supporting grant* | 5,858 |
| Hamilton Youth Poets/Hamilton Arts Council | |
| March break camp* | 5,000 |
| Hamilton Youth Steel Orchestra/The John Howard Society | |
| Supporting grant* | 5,000 |
| Hamilton-Wentworth Catholic District School Board | |
| Empower Reading Program | 250,000 |
| Equal Opportunities Fund | 271 |
| Freedom Arts Project* | 6,000 |
| Intramural Soccer League & Learn* | 10,000 |
| L.E.A.D. Successful Transtions Project* | 30,300 |
| Recess project with an after-school twist* | 10,000 |
| St. Helen community centre | 27,120 |
| Teacher small grants* | 12,380 |
| Harbourfront Corporation | |
| Fleck Dance Theatre | 300 |
| Healing Arts and Recovery with Peer Support/City Housing Hamilton | |
| Supporting grant and tenant engagement* | 15,000 |
| Heart and Stroke Foundation of Ontario | |
| Supporting grant | 2,192 |
| Hearts Together For Haiti | |
| Supporting grant | 4,000 |
| Helping Hands Street Mission | |
| Supporting grant | 2,000 |
| Heritage Hamilton Foundation | |
| Neighbourhood small grants* | 1,500 |
| Hillcrest Elementary School/Hamilton Foundation for Student Success | |
| Community Collaboration | 5,000 |
| Holbrook School/Hamilton Foundation for Student Success | |
| Butterfly project* | 400 |
| Inclusive educational excursion* | 735 |
| Hope for Wildlife Society | |
| Supporting grant | 500 |
| Hospital Family Houses of Ontario | |
| Mark Preece Family House | 2,600 |
| The Hospital for Sick Children | |
| Supporting grant | 2,593 |
| Imagine in the Park Children's Arts Festival/Rotary Club of Hamilton AM | |
| Supporting grant | 4,500 |
| Supporting grant* | 3,000 |
| Indspire | |
| Building Brighter Futures | 35,000 |
| Industry Education Council of Hamilton | |
| Computer/coding workshops* | 54,986 |
| Indwell Community Homes | |
| Data analyst* | 23,000 |
| Neighbourhood small grants* | 500 |
| Interval House of Hamilton | |
| Be More Than a Bystander | 1,000 |
| Emergency shelter | 1,000 |
| Jared's Place* | 11,000 |
| Mentor Action Program | 1,472 |
| Purchase of furnace* | 5,000 |
| Supporting grant | 10,000 |
| Supportive mothering | 5,428 |
| The Hero's Journey Program | 10,000 |
| Jazz.FM91 Inc. | |
| Supporting grant | 438 |
| The John Howard Society | |
| ACHIEVES* | 32,083 |
| Neighbourhood small grants* | 30,189 |
| Supporting grant | 1,000 |
| YARD program* | 60,000 |
| Joseph Brant Hospital Foundation | |
| Labour & Delivery Unit capital campaign | 5,000 |
| Supporting grant | 8,095 |
| Journalists for Human Rights | |
| Supporting grant | 75,000 |
| Joy Bible Camp | |
| Supporting grant | 1,000 |
| Jump In Foundation | |
| Physical activation program | 10,000 |
| Physical activation program* | 10,000 |
| Jump Math | |
| Supporting grant | 50,000 |
| Juravinski Hospital & Cancer Centre Foundation/Hamilton Health Sciences Foundation | |
| Supporting grant | 2,000 |
| Justice Centre for Constitutional Freedoms | |
| Supporting grant | 2,000 |
| Juvenile Diabetes Research Foundation | |
| Supporting grant | 813 |
| Kartarpur Charitable Fund | |
| Supporting grant | 2,000 |
| Kiwanis Music Festival Association of Greater Toronto | |
| Supporting grant | 500 |
| Laidlaw Memorial United Church | |
| Partners in Learning* | 500 |
| Learning Disabilities Association of Halton | |
| Reading Rocks!* | 10,000 |
| The Learning Partnership | |
| Supporting grant | 25,000 |
| Let's Talk Science | |
| Supporting grant | 25,000 |
| Liberty for Youth | |
| Bright Choices | 20,000 |
| Prodigal Sonz* | 5,000 |
| Lighthouse Program for Grieving Children | |
| Supporting grant | 2,000 |
| Lions Foundation of Canada | |
| Autism Assistance Dog Guides | 1,000 |
| Canine Vision | 500 |
| Wish List | 700 |
| Living Rock Ministries | |
| Job coach | 2,000 |
| Operation Christmas Blessing | 4,000 |
| Rock in Action* | 5,000 |
| Rock Resources* | 25,000 |
| Supporting grant* | 8,329 |
| Loran Scholars Foundation | |
| Supporting grant | 80,000 |
| Lynwood Charlton Centre | |
| Supporting grant | 500 |
| Under the Williows | 12,500 |
| MacNab Street Presbyterian Church | |
| Supporting grant | 10,905 |
| March of Dimes Canada Non-Profit Housing Corporation | |
| Jason's House | 5,000 |
| MaRS Discovery District | |
| Solution Labs/SVX/Centre for Impact Investing | 325,000 |
| Mathstronauts/McMaster University-MILO | |
| STEM Hacks* | 2,000 |
| McGill University | |
| Friends of McGill Hockey | 200 |
| Supporting grant | 2,000 |
| McMaster Children's Hospital Foundation | |
| Medical equipment | 700 |
| McMaster University | |
| Basic Income Project* | 17,177 |
| Dynamics of intimate partner violence study* | 35,000 |
| NICU-to-home transitions study* | 14,845 |
| President's Fund | 1,500 |
| Scholarship award | 250 |
| Supporting grant | 2,000 |
| The Collaboratorium* | 8,000 |
| Mealshare Aid Foundation | |
| Hamilton expansion | 20,000 |
| Melrose United Church | |
| Supporting grant | 6,272 |
| Mennonite Coalition for Refugee Support | |
| Supporting grant | 2,000 |
| Métis Women's Circle | |
| The Song-Bird and the Healing Waters | 20,000 |
| Mission Services of Hamilton | |
| Supporting grant | 11,538 |
| The 196 After-school Program* | 30,000 |
| Youth Food Program | 15,000 |
| Missionaries of Charity | |
| Supporting grant | 100 |
| Mohawk College | |
| Bursaries | 10,165 |
| City School students safety wear | 4,100 |
| MADD Canada | |
| SmartWheels program | 1,000 |
| Musicata | |
| Supporting grant | 2,000 |
| Muskoka Conservancy | |
| Supporting grant | 1,000 |
| National Youth Orchestra | |
| Supporting grant | 1,000 |
| Native Women's Centre | |
| Gift of giving | 2,350 |
| Trauma Sensitive Yoga | 2,500 |
| Neighbour to Neighbour Centre (Hamilton) | |
| Children's food literacy programs | 40,000 |
| Food skills programming | 15,000 |
| Jack Parent Reading Program | 16,020 |
| Jack Parent Reading Program* | 10,000 |
| Math Success Program* | 14,735 |
| Neighbourhood small grants* | 6,000 |
| Supporting grant | 5,500 |
| Nelson Youth Centres | |
| Supporting grant | 7,000 |
| New Vision United Church | |
| Music Hall | 5,000 |
| Music Hall* | 25,000 |
| Supporting grant* | 9,743 |
| NGen Youth Centre/Hamilton East Kiwanis Boys' and Girls' Club | |
| Reprogrammed* | 5,000 |
| Niwasa Kendaaswin Teg | |
| NYA:WEH Elementary* | 37,500 |
| North End Breezes/North Hamilton Community Health Centre | |
| Supporting grant* | 1,580 |
| North Hamilton Community Health Centre | |
| Grub Club: What's Cooking?* | 9,500 |
| PATH program* | 8,334 |
| Pathways to Education neighbourhood expansion | 30,000 |
| Pathways to Education FitRec program* | 5,000 |
| Trauma Sensitive Yoga for LGBTQ2S+ individuals* | 2,580 |
| Ontario Music Festivals Association | |
| Supporting grant | 1,000 |
| Ontario Registered Music Teachers' Association - Hamilton Branch, Scholarship Fund | |
| Supporting grant | 900 |
| Ontario Registered Music Teachers' Association Niagara-on-the-Lake | |
| Supporting grant | 700 |
| Opening Hearts | |
| Sibling Support Network* | 3,000 |
| Organized Kaos Life & Trade | |
| Supporting grant | 2,000 |
| The Owl Foundation | |
| Pine shavings | 1,500 |
| Supporting grant | 2,841 |
| PAL Canada Foundation | |
| Supporting grant | 1,000 |
| Paroisse Saint-Philippe | |
| Supporting grant | 4,000 |
| Peel Music Festival | |
| Supporting grant | 300 |
| Philpott Memorial Church | |
| Supporting grant | 9,344 |
| Players' Guild of Hamilton Inc. | |
| Supporting grant* | 5,858 |
| Port Dover and Area Life Line Food Bank | |
| Supporting grant | 2,000 |
| Project SHARE of Niagara Falls | |
| Food bank | 5,000 |
| Rainbow Railroad | |
| Supporting grant | 5,000 |
| Redeemer University College | |
| Music Scholarship | 1,000 |
| Supporting grant | 2,000 |
| Rideau Hall Foundation - Fondation Rideau Hall | |
| Post-Secondary Access and Success Network* | 50,000 |
| Riverdale Women's Empowerment Group/The John Howard Society | |
| Weekly support group* | 2,000 |
| Robert Land Community Association | |
| Eva Rothwell Centre | 2,000 |
| Supporting grant | 4,400 |
| Robert Land Community Association/Eva Rothwell Centre | |
| Food closet and outdoor program | 7,000 |
| Rotary Club of Hamilton Sunshine Fund | |
| Healthy Cooking on a Budget | 5,000 |
| Wever CORE Kids | 10,000 |
| Royal Botanical Gardens | |
| Children's programs | 2,500 |
| Rose garden bed | 25,000 |
| Supporting grant | 11,828 |
| Supporting grant* | 3,988 |
| Royal Canadian Humane Association | |
| Supporting grant* | 3,719 |
| Royal Conservatory of Music | |
| Supporting grant | 300 |
| Rygiel Supports for Community Living | |
| Supporting grant | 2,336 |
| Supporting grant* | 3,580 |
| Salal Foundation | |
| Canopy initiative | 50,000 |
| The Salvation Army Hamilton Booth Centre | |
| Dundas food bank | 5,000 |
| Ellen Osler Home Hatt Street reconstruction project* | 19,850 |
| New Choices | 1,800 |
| New Choices* | 3,500 |
| Supporting grant | 1,736 |
| Salvation Army Simcoe Community Church | |
| Dunnville food bank | 5,000 |
| Scientists in School | |
| STEM Enrichment | 10,000 |
| Scleroderma Society of Canada | |
| Supporting grant | 5,000 |
| Scleroderma Society of Ontario | |
| Supporting grant | 5,000 |
| Scouts Canada - Central Ontario Service Centre | |
| Supporting grant | 250 |
| Shakespearience Performing Arts | |
| School programs | 4,000 |
| School programs* | 3,000 |
| Shalem Mental Health Network | |
| Counselling Assistance Fund | 15,000 |
| Sheridan College, Oakville Campus | |
| Music, Theatre, Performance Program | 500 |
| Shriners Hospitals for Children | |
| Supporting grant | 1,168 |
| The Simcoe Caring Cupboard | |
| Food bank | 5,000 |
| Skills for Change | |
| Bridging the Gap* | 15,000 |
| Small Change Fund | |
| Supporting grant | 30,000 |
| Social Planning & Research Council of Hamilton | |
| Neighbourhood small grants* | 6,370 |
| Ontario Knowledge Network for Student Well-Being* | 3,400 |
| Soaring Spirit Festival* | 2,699 |
| Society of our Lady of the Most Holy Trinity (Canada) | |
| Supporting grant | 35,186 |
| Society of St. Vincent de Paul Ontario Regional Council | |
| Ridgeway food baskets | 5,000 |
| Soroptimist International of Hamilton-Burlington | |
| Live Your Dream | 5,000 |
| St. Andrew's United Church | |
| Soup for the Soul | 2,000 |
| St. David's Presbyterian Church | |
| Neighbourhood small grants* | 2,000 |
| St. Jerome's University | |
| Supporting grant | 4,000 |
| St. Joseph's Healthcare Foundation | |
| Macrophages and fibrotic lung disease* | 30,000 |
| Mental health services at West 5th location | 10,000 |
| Supporting grant | 16,000 |
| Youth Wellness Centre's Empowerment Fund* | 5,000 |
| St. Joseph's Home Care | |
| Supporting grant* | 13,000 |
| St. Joseph's Villa Foundation | |
| Enhancing care* | 19,244 |
| Supporting grant | 30,000 |
| St. Matthew's House | |
| Adopt-a-Family Program | 5,000 |
| Supporting grant | 18,457 |
| St. Patrick's Parish | |
| Supporting grant | 40,271 |
| St. Raphael's Parish Church | |
| Supporting grant | 6,000 |
| Start2Finish | |
| Junior Coaches Program* | 29,000 |
| Running & Reading Club | 8,000 |
| Running & Reading Club* | 16,000 |
| Stoney Creek Community Food Bank | |
| Supporting grant | 5,000 |
| The Stop Community Food Centre | |
| Supporting grant | 50,000 |
| Strata Montessori Adolescent School | |
| Supporting grant | 3,018 |
| Streetlight Ministries | |
| Building Fund | 2,000 |
| Student Open Circles | |
| Community Volunteer Circles | 10,700 |
| Supporting grant | 1,472 |
| Swim, Drink, Fish Canada | |
| Supporting grant | 648 |
| SwimAbility Hamilton/Special Olympics Ontario Inc. | |
| Swim lessons* | 1,700 |
| Tamarack Institute for Community Engagement | |
| Supporting grant | 50,000 |
| Tastebuds/Social Planning & Research Council of Hamilton | |
| Supporting grant* | 5,051 |
| Telling Tales | |
| Community outreach | 2,000 |
| Community outreach* | 8,000 |
| Dundas residents* | 3,000 |
| In-school program* | 3,000 |
| Supporting grant | 25,000 |
| Tetra Society of North America | |
| Hamilton Tools for Tykes | 3,500 |
| The National Ballet of Canada | |
| Supporting grant | 500 |
| Theatre Ancaster | |
| Supporting grant* | 5,858 |
| Theatre Aquarius | |
| Indigenous Arts Program | 2,500 |
| Newcomer Arts program | 3,000 |
| Ovation Outreach Enrollment Program | 5,000 |
| Supporting grant | 4,500 |
| Threshold School of Building | |
| Job developer | 20,000 |
| Supporting grant | 10,000 |
| THRIVE | |
| Community Navigator* | 10,000 |
| Counselling for children* | 8,800 |
| Oasis Program* | 6,000 |
| Supporting grant | 10,000 |
| Luminato | |
| Supporting grant | 300 |
| Toronto International Film Festival | |
| Supporting grant | 300 |
| Trinity Presbyterian Church | |
| Repeat Champions* | 1,500 |
| True Patriot Love Foundation | |
| Supporting grant* | 250 |
| TVOntario | |
| Supporting grant | 438 |
| The Tyndale Foundation | |
| Supporting grant | 2,336 |
| United Way Halton & Hamilton | |
| Supporting grant | 15,133 |
| University of Guelph | |
| Bursaries | 4,000 |
| University of Notre Dame | |
| Supporting grant | 100 |
| University of St. Michael's College | |
| Supporting grant | 4,000 |
| University of Toronto | |
| President's Club | 1,000 |
| Urquhart Butterfly Garden/Conserver Society of Hamilton & District, Inc. | |
| Summer educational program* | 2,280 |
| Vancouver Foundation | |
| Green Shield Canada Six 4 Six | 300,000 |
| Victoria Foundation | |
| Green Shield Canada Six 4 Six | 225,000 |
| Victorian Order of Nurses - Hamilton Branch | |
| Meals on Wheels | 1,000 |
| Meals on Wheels* | 20,000 |
| Village Theatre (Waterdown) Inc. | |
| Supporting grant* | 5,858 |
| War Amputations of Canada | |
| Supporting grant | 1,500 |
| WE Charity | |
| Schools in Rongena, Kenya | 4,000 |
| Supporting grant | 25,000 |
| Welcome Inn Community Centre of Hamilton | |
| Community Christmas | 2,150 |
| Educational programming | 5,500 |
| Neighbourhood small grants* | 2,880 |
| New Horizons Thrift Store training program* | 10,000 |
| Wellwood Resource Centre of Hamilton | |
| Alumni Family Days* | 5,000 |
| Children's program | 5,000 |
| Curveball | 5,000 |
| Kids in the Kitchen/Power Up | 10,000 |
| Supporting grant* | 5,979 |
| Wesley Urban Ministries | |
| Christmas and holiday store | 1,000 |
| Food Service Training Program* | 25,000 |
| Snacks for afterschool programs* | 10,000 |
| Supporting grant | 6,538 |
| West Lincoln Community Care | |
| Smithville food bank | 5,000 |
| Westdale Cinema Group | |
| Neighbourhood small grants* | 500 |
| Projection room reconstruction | 25,000 |
| Westdale Theatre renovation | 5,000 |
| Wever CORE/McMaster University | |
| McMaster Trip* | 4,000 |
| Wever CORE/Rotary Club of Hamilton Sunshine Fund | |
| Community Christmas party | 2,500 |
| Supporting grant* | 7,829 |
| Youth Achieves/Leaders in Training/Arabic Speaking Navigator programs* | 13,700 |
| Windmill Microlending | |
| Supporting grant | 50,000 |
| WindsorEssex Community Foundation | |
| Green Shield Canada Six 4 Six | 450,000 |
| Woodview Children's Centre | |
| Supporting grant | 1,000 |
| Word & Deed Ministries Canada Inc. | |
| Supporting grant | 2,000 |
| Workers Arts & Heritage Centre | |
| School Visits Program | 1,500 |
| YMCA of Hamilton/Burlington/Brantford | |
| Beyond the Bell | 10,000 |
| Beyond the Bell* | 10,000 |
| Camp Wanakita | 4,000 |
| Camp Wanakita bursary | 1,000 |
| Camp Wanakita outripping equipment | 19,898 |
| Farah Family Youth Peace Scholarship | 5,000 |
| Peace Medal Breakfast | 5,000 |
| York University | |
| Justine Giuliani Bursary | 3,595 |
| Youth and Philanthropy Initiative Canada | |
| Hamilton schools* | 35,000 |
| Women4Change Youth Engagement Award* | 5,000 |
| YWCA Hamilton | |
| A Holiday to Remember | 3,000 |
| Food for Thought* | 15,000 |
| Phoenix Place | 1,000 |
| Supporting grant* | 200 |
| Syrian girls leadership and March break camp* | 5,000 |
| Transitional Living Program | 5,000 |
Community leadership projects
These projects include HCF’s own community leadership activity, as well as projects where we act as an intermediary to assemble funding for multi-organizational community initiatives. The projects may span multiple years, and are funded by new donations as well as by Board-directed funds. Current year funders are AbleLiving Services Inc., City of Hamilton, Community Foundations of Canada, The Fairmount Foundation, Green Shield Canada, Hamilton Family Health Team, Hamilton Health Sciences Corporation, Higher Education Quality Council of Ontario, McMaster University, Saint Elizabeth Health Care, St. Joseph’s Health System, Thrive Group.
Leadership project costs include research, community consultation, meeting costs, education and communication materials. Spending for 2019-20 is:
| ABACUS: Advancing post-secondary access | 227,668 |
| Community investing project | 70,561 |
| Green Shield Canada Six4Six initiative | 26,265 |
| Hamilton Anchor Institution Leadership Table | 165,150 |
| Student success initiatives | 21,463 |
| Other leadership projects | 22,572 |
| Total community leadership projects | 533,679 |
In mid-March, HCF’s Board established its Pandemic Response Fund with an initial $2 million commitment, underpinned by a strategy that would enable:
Immediate emergency granting focused on Hamiltonians most affected by the pandemic, including people experiencing homelessness and lacking food security, those who are immuno-compromised, isolated seniors, newcomers and Indigenous people. Before the end of March, proactive grants totalling $305,000 were made to 16 Hamilton organizations to help address these immediate needs.
This work formed the starting point for the three ongoing streams of the fund:
Meeting basic needs (Short-term)
Providing basic needs related to food security, shelter, hygiene.
Stabilization (Short- to medium-term)
Supporting charities to deliver frontline, critical services to vulnerable populations affected by quarantine, closures, shortages, access to services, loss of income, or other economic factors. This stream aims to maintain or expand local capacity to address all aspects of the outbreak as efficiently as possible, and help close gaps where services are not covered by government relief funding.
Recovery and rebuilding (Medium- to long-term)
Recognizing that the recovery from this crisis will extend far into the foreseeable future, this stream will enable the Foundation’s continued flexibility and responsiveness to Hamilton’s evolving needs, with the goal of strengthening its long-term resilience.
Beyond our direct support through the Pandemic Response Fund, we are shaping our existing leadership priorities to the city’s new and emerging realities in multiple ways, including:
Education
Increasing the likelihood that young Hamiltonians will participate in university, college or the trades is a critical community investment that can have a positive impact on people, neighbourhoods and our city. HCF supports education in numerous ways, through our ABACUS initiative and beyond.
HCF is supporting its ABACUS grantees and other education organizations in Hamilton to best serve their communities through the pandemic. We surveyed our 23 ABACUS grantees to understand how they are responding to COVID-19, physical distancing measures and online schooling. Based on their responses HCF has been working with them to:
We continue to listen and learn from our grantees to be flexible in supporting middle-school-aged youth and their broader community.
Neighbourhoods
The Foundation’s longstanding commitment to neighbourhoods has focused in recent years on small grants that promote health equity and leadership development. Over the last year, HCF conducted a pilot on new ways of delivery that would expand the reach of its grants. We also conducted a community scan to understand better, what residents would like to learn more about to support their community work. While both these projects are temporarily paused, the research will help to inform how the Foundation continues to support healthy, inclusive neighbourhoods in a post-pandemic reality.
Engaging, learning from and working with Indigenous communities
In October 2019, HCF’s Board of Directors made a commitment to strengthen the Foundation’s relationship with Indigenous communities as part of its work towards truth and reconciliation. We recognize that the Foundation’s history and current operations are connected to Canada’s colonial history and current context. To be partners, the Foundation must start, at all levels of our organization, by working alongside Indigenous communities and organizations to explore how we grant, invest and convene across our community.
HCF has strong relationships with several local Indigenous organizations and leaders, and supports multiple Indigenous-led initiatives through granting and impact investing. HCF is now working to build our response both to the Truth and Reconciliation Commission of Canada’s Calls to Action and to the unique needs of this community, especially as a result of COVID-19.
| We thank everyone who contributes to sending children to camp. Contributors of over $500 are listed below: |
|---|
| Congregation of the Sisters of St. Joseph in Canada |
| Elizabeth Eldridge |
| Fabris Inc. |
| The Hamilton & District Soccer Association |
| Hamilton All Star Jazz Band |
| Judith McCulloch |
| Real McCoys |
| United Way Halton & Hamilton |
| Elizabeth Whetham |
| HCF received donations in memory of: | ||
|---|---|---|
| Mary Abou El-Assal | Gregory John Glover | Rose Sazio |
| Mary Acs | Leah Gow-Ricketts | Brenda Jean Sherring |
| Fortunata Barresi | The Honourable C. Raymond Harris | Cathy Skibinski |
| Claude Barrette | Bill & Marion Holton | Charles Moore Smalley |
| Frederick (Fred) Stephen Bart | Bruce Robert Horsley | Frank Szostak |
| Eric Richard Cannon | Bruce Jaffrey | Dr. Lewis Tauber |
| Joyce Frid Caygill | Anne Hamilton Jones | Joyce Mary Tidball |
| Fred (Derf) James Charters | Sarah & Clare Lakin | Fernando (Fern) Anthony Viola |
| Adam Hugh Clark | William (Bill) Morris, Q.C. | Reno Basil Violin |
| David Colling | Frances Ann (Fran) O'Brien-Flaherty | Daniel Bell Watt |
| James Donald Coons | Peter (Pete) Palmer Jr. | Ronald (Ron) Ernest Weston |
| Rosemarie Cooper | The Honourable Paul Gillrie Philp | Sigrid Marianne Whelan |
| Ray Cunnington | Lois Marion Reid | Barbara Ann Winfield |
| William Gordon Demerling | Annetta & Poyntz Ricketts | Jeffory (Jeff) James Wolfenden |
| Sharon Bernadette Dredge | Marie Louise Robbins | |
| Peter Friedman | Joan Marion Roscoe | |
| HCF received donations in honour of: | ||
|---|---|---|
| Dr. Richard Bethune | Morag Halsey | Dr. Anne M. Pearson |
| Steve Buist | Stephanie Hatzifilalithis | Layna Potocic |
| Bob Carr | Dr. Art Heidebrecht | Gail Rappolt |
| Michael & Ida Caruso’s 40th wedding anniversary | Jane & Steve Locke | Thomas Rennie |
| Terry Cooke | Judith McCulloch | Adele Stanfield |
| Dr. Fionnella Crombie | Dr. Don & Kathryne McLean | Joshua E., Amy & Liam Thorne |
| Heidi Van Damme | Sheree Meredith | Zhenqi Wang |
| Former staff of Regal Greetings & Gifts | Paul & Carolyn Milne | |
| HCF received gifts in kind from: |
|---|
| Amica Dundas |
| City of Hamilton |
| Connor, Clark & Lunn Private Capital |
| ESB Lawyers LLP |
| Gowling WLG |
| The Hamilton Spectator |
| ImpactLink Capital |
| Jarislowsky Fraser Limited |
| McMaster University Centre for Continuing Education |
| Soundbox |
| Unicorn Rebellion |
| Field-of-interest funds | |
|---|---|
| Alfred & Joan Robertshaw Memorial Fund | 842,506 |
| The Alice Jean Ainsworth Memorial Fund | 2,027,703 |
| The Angel Fund* | 151,242 |
| Antonina Lombardo Fund | 181,923 |
| Arthur & Helena Lemon Fund | 127,162 |
| Barbara & Bob Harwood Fund | 243,229 |
| Barbara Bethune Fund*† | |
| Barbara Farnan Fund | 160,443 |
| Betty & Jack George Family Fund | 32,479 |
| Bill & Tina Seale Fund | 374,196 |
| Board Leadership Fund | 26,627 |
| Carolyn A. Milne Leadership Forum Fund | 67,538 |
| Charles & Ret Swire Fund | 264,158 |
| Community Health, Education & Research Fund | 1,614,393 |
| Dorothy & Frank Bliss Fund | |
| Mary S. & James P. Phin Respiratory Disease Research Fund | |
| McGregor Clinic Fund | |
| Delaware Fund | 463,704 |
| Dougher Community Fund | 3,101,582 |
| Edward & Gladys Halloran Memorial Fund | 988,812 |
| Everard Hambro Fund | 50,037 |
| First Place, Hamilton Tomorrow Fund | 320,942 |
| Florence E.S. Hutton Fund* | 575,289 |
| Foxcroft Family Youth Fund | 33,743 |
| Fund for Underprivileged Children | 579,887 |
| George & Shirley McBride Foundation Fund | 1,355,623 |
| Gibson Trust/Town of Flamborough | 41,949 |
| Giovanni & Grazia Criminisi Literacy Fund* | 42,648 |
| The Glenn & Sidney Sellick Fund | 12,742 |
| Hogarth Family Pioneer Energy Fund | 1,414,479 |
| Ike & Shahnaz Ahmed Foundation Fund | 43,501 |
| James Walker Culhane Trust Fund | 416,446 |
| Jane C. LeWarne Fund | 21,884 |
| Jeanne Scott Fund* | 1,191,046 |
| Joan C. Watt Memorial Fund | 45,745 |
| John Dennis Holmes Fund | 64,989 |
| Kenneth Boothe Young & Marie Catherine Young Fund | 1,489,445 |
| Lillian & Marvin Goldblatt Family Fund | 274,314 |
| Lillian M. Shaw Fund | 354,425 |
| Marchese Health Care 50th Anniversary Legacy Fund | 60,285 |
| Mary Lauder Cassidy Fund | 315,510 |
| Nelson Allan Fund | 178,621 |
| Note-Able Music Fund | 75,495 |
| Ray Lowes Environmental Fund | 505,293 |
| Royal Canadian Humane Association Fund | 88,814 |
| Russell I. Elman Fund | 1,920,826 |
| School Sisters of Notre Dame Legacy Fund† | |
| Shirley M. Elford Gift of Today Fund | 135,873 |
| Terry & Brenda Yates Fund | 1,067,285 |
| The Van Dusen Fund* | 529,712 |
| Vera & Percy Tomlinson Fund | 119,269 |
| W. Robert & Marion S. Shivas Conservation Trust Fund | 380,969 |
| Women 4 Change Fund | 243,692 |
| Youth & Philanthropy Fund | 142,314 |
| Ontario Endowment for Children & Youth in Recreation Fund | |
|---|---|
| This fund’s balance includes matching funds from the Province of Ontario in 2002 to encourage the participation of children and youth in recreation. | |
| Anonymous fund | |
| Bank of Montreal Fund for Children & Youth in Recreation | |
| The CHML Children’s Fund | |
| The Clark Family Fund | |
| The David Gow Fund | |
| The Deslauriers Fund | |
| The Emma Templeton Fund | |
| The Foxcroft Family Fund | |
| Gallagher Family Fund | |
| Hamilton–Hydro Electric Company Fund | |
| The Hamlin Family Fund | |
| Judith & Peter McCulloch Fund | |
| The Junior League Centennial Endowment Fund for Youth | |
| The Mildred E. Hunter Fund | |
| Morgan Firestone Foundation Fund for Youth | |
| Mr. & Mrs. Colin S. Glassco Fund | |
| Pioneer Energy Fund for Children & Youth | |
| PricewaterhouseCoopers LLP Hamilton Children and Youth Millennium Fund | |
| TD Bank Financial Group Fund | |
| Zonta Club of Hamilton 1 Fund | |
| Other donations under $5,000 | |
| Fund balance | 1,150,142 |
| Donor-advised funds | |
|---|---|
| Apollo Fund† | |
| ArcelorMittal Dofasco Children and Youth Fund | 92,965 |
| Audrey & Alan Moffett Fund† | |
| Bisaro Family Fund* | 141,714 |
| Chedoke Health Foundation Fund | 5,137,778 |
| Clark Family Foundation Fund | 1,258,647 |
| Cooke Family Fund* | 28,570 |
| David Davis Memorial Fund† | |
| Dr. Bob & Mildred Kemp Palliative Care Education Fund | 141,730 |
| Dufresne-Ray Family Fund† | |
| Ed Smee Conserver Society Environmental Fund | 44,357 |
| Edith H. Turner Foundation Fund | 11,347,474 |
| Elham & Joseph Farah Family Foundation Fund*† | |
| Ella Baird & Grace Baird McQueen Memorial Fund/A.J. McQueen | 60,443 |
| Ernst Family Fund*† | |
| Fengate Community Foundation Fund* | 1,212,777 |
| The Gilmour Fund | 2,799,492 |
| Glen & Debra Swire Fund | 73,583 |
| Great Lakes Trust Fund* | 26,477 |
| GSC Community Impact Fund | 715,959 |
| Heather & Ross Hamlin Fund* | 11,324,574 |
| Heels Family Vocal Award Fund* | 446,082 |
| Hogarth Family Foundation Fund | 2,695,978 |
| Hugh C. Arrell Memorial Fund | 60,750 |
| Hundred Waters Foundation Fund* | 36,729 |
| Hutton Family Fund*† | |
| Jeremy Hepner Fund | 26,562 |
| John & Esther Marshall Memorial Fund | 298,955 |
| John & Mary Reesor Fund | 171,727 |
| Karen & Peter Turkstra Family Foundation Fund† | |
| Kathleen C. Nolan Education Fund | 46,157 |
| Kirkpatrick Fund | 51,847 |
| Kismet Fund† | |
| Lawyers' Legacy for Children the Ray Harris Fund | 390,441 |
| Lee Hepner Award Fund | 31,766 |
| Lois Evans Natural Heritage Fund | 136,382 |
| Losani Family Foundation Fund | 472,629 |
| The Malloch Foundation Fund | 677,529 |
| Marjorie Hawkins Clark Fund | 1,131,671 |
| Mark & Barbara Nimigan Fund | 129,962 |
| The Martin Foundation Fund | 1,389,243 |
| Mayberry Family Fund* | 237,947 |
| McCallum, McBride Fund | 1,104,368 |
| Meredith Family Fund | 30,785 |
| Michael Chamberlain Fund | 178,844 |
| Mildred Dixon Holmes - Youth Orchestra Fund | 372,984 |
| The Milne McGrath Fund | 914,856 |
| Ray Brillinger & Cy Hack Fund | 175,012 |
| Robert P. Beres Fund† | |
| The Ron & Gina Fraser Endowment Fund | 138,511 |
| Rotary Club of Hamilton East-Wentworth Foundation Fund | 109,795 |
| Shirley M. Elford Artist's Fund | 59,808 |
| Stover Family Fund† | |
| Tara Lynn Giuliani Foundation | 268,913 |
| Ted & Karin Bossence Fund* | 110,486 |
| The Unicorn Fund | 22,627 |
| Thorne Family Fund | 38,192 |
| Tran Family Fund* | 42,470 |
| W. L. Carpenter Memorial Fund* | 2,588,283 |
| Williams Family Fund* | 93,673 |
| The Young Fund* | 35,921,236 |
| Designated funds | |
|---|---|
| Adam and Olive Clark Memorial Fund | 355,665 |
| Art and Barb Worth Fund | 139,638 |
| Barbara and Ronald Bayne Fund | 81,598 |
| Cygnus Fund | 177,016 |
| Douglas J. Clark Fund* | 151,876 |
| Eva Rothwell Resource Centre Fund | 99,956 |
| Frank Charles Miller Fund* | 2,286,123 |
| James P. & Mary S. Phin Charitable Fund | 247,694 |
| Joe, Filomena and George Seliga Holdings Fund† | |
| Phenix Fund for Animal Welfare | 133,748 |
| Porto Family Fund† | |
| Samaritans' Tithe Fund | 299,977 |
| Stoney Creek Health Fund | 855,378 |
| United Nations Culture of Peace Hamilton Fund | 32,199 |
| United Way Fund/Kenneth R. Walsh | 203,429 |
| Walter & Mildred Danby Fund* | 557,790 |
| Scholarship and bursary funds | |
|---|---|
| Albert & Betty Walters Fund | 106,276 |
| Amanda Marie Cowan Memorial Scholarship Fund | 29,953 |
| Bernie Morelli Memorial Bursary Fund | 31,939 |
| Charlie and Mabel Duncan Memorial Bursary Fund | 31,939 |
| Christina Hamilton Scholarship Fund | 53,501 |
| Cowan Family Fund | 27,475 |
| CPRS Hamilton Legacy Fund | 33,256 |
| Daniel Giannini Fund | 1,148,301 |
| Eugene B. Eastburn Fellowship Fund | 1,041,734 |
| General Bursary Fund/Genevieve A. Chaney & Cordelia C. Ensign | 911,676 |
| Geritol Follies Bursary Fund | 187,590 |
| Howard Fairclough Organ Scholarship Fund | 68,058 |
| James Darby Bursary Fund | 426,047 |
| Jeff Dickins Memorial Fund† | |
| Jervis B. Webb Company of Canada (Daifuku) Scholarship Fund | 313,356 |
| John E. VanDuzer Scholarship Fund | 44,139 |
| Mildred Dixon Holmes - Artist of the Year Fund | 37,380 |
| Music Bursary Fund | 46,514 |
| Ross F. Webb Bursary Fund | 80,512 |
| Rundle Foreign Study Bursary | 52,535 |
| Russell & Elizabeth Lindley Fund | 187,025 |
| William Allison Haynes Fund | 108,644 |
| Agency endowment funds | |
|---|---|
| AbleLiving Services Inc. Mary Traini Legacy Fund | 140,160 |
| Art Gallery of Hamilton - Building a Legacy Fund | 247,720 |
| Bay Area Science & Engineering Fair Fund | 37,153 |
| Canadian Warplane Heritage Museum Endowment Fund | 34,925 |
| Cancer Assistance Program (CAP) Endowment Fund | 38,596 |
| Catholic Children's Aid Society - Ersilia Dinardo Scholarship Fund | 57,468 |
| Catholic Children's Aid Society - Ralph and Rose Sazio Scholarship Fund | 143,268 |
| Catholic Children's Aid Society of Hamilton Endowment Fund | 149,550 |
| Children's International Learning Centre Endowment Fund | 74,639 |
| Community Living Hamilton Endowment Fund | 121,373 |
| Dr. Bob Kemp Hospice Endowment Fund | 129,363 |
| Dundas Valley School of Art Endowment Fund | 89,359 |
| Hamilton Naturalists' Club: | |
| Conservation & Education Endowment Fund | 55,858 |
| Ecological Research Endowment Fund | 36,834 |
| Habitat Preservation Endowment Fund | 221,075 |
| Hamilton Public Library Library Legacy Fund | 851,442 |
| HWDSB Foundation Endowment Fund | 801,592 |
| Interval House (Hamilton) Freedom and Hope Fund | 114,229 |
| The RHLI Endowment Fund | 293,544 |
| Rotary Club of Hamilton - Rotary Forever Fund | 100,344 |
| Scouts Canada, Hamilton Wentworth Endowment Fund | 193,196 |
| United Way Tomorrow & Forever Fund | 1,469,438 |
| YWCA Hamilton Endowment Fund | 854,332 |
| Administration funds | |
|---|---|
| Anonymous Fund | 12,069 |
| Brenda & Terry Yates Fund | 99,201 |
| Cameron K. MacGillivray Fund | 25,661 |
| Dr. Robert & Helen Lofthouse Fund | 42,472 |
| Judith & Peter McCulloch Fund | 40,274 |
| Judith McCulloch Tribute Fund | 11,025 |
| Marjorie & Bill Nelson Fund | 99,015 |
| Ross & McBride, LLP Fund | 22,379 |
| Thérèse & Kent Newcomb Fund | 9,995 |
| Funds in progress |
|---|
| Bruce Hamilton Family Fund* |
| Bruce Trail Conservancy Endowment Fund |
| Conducive Fund |
| Dream Weaver Fund |
| Mark Preece Family House Endowment Fund |
| Phantom Moms Fund* |
| Revolution Hope: Claire Lewis Foundation Fund |
| Sons of Italy Hamilton Trieste Lodge Legacy Fund |
| Tamara and Robert Henderson Family Fund* |
| Tweedell Goodbrand Family Fund |
| Community Fund: Unrestricted fund J-Z | |
|---|---|
| J.M. Walter Hahn Fund | 5,000 |
| Jack A. Winser Fund | 155,007 |
| Jack McNie Fund | 26,000 |
| James & Irene Wilson Fund | 6,000 |
| James & Mary Phin Fund | 106,545 |
| James D. Redmond Fund | 6,033 |
| Jane Milanetti Fund | 14,650 |
| Jessie Rumney Fund | 10,000 |
| Joan W. Rutherford Fund | 5,000 |
| John and Joan Bothwell Fund | 10,000 |
| John H. Frid Fund | 548,347 |
| John Shea Memorial Fund | 8,387 |
| Josephine Magee Fund | 204,057 |
| Kathleen L. McBride Fund | 11,632,794 |
| Kathryn Jones Fund | 130,186 |
| Lakin Family Fund | 15,615 |
| Laurence Cholwill Patterson Fund | 351,146 |
| Leanora M. Spicer Fund | 26,600 |
| Lillian Boyd Barnby Fund | 10,000 |
| Lindsay M. McLennan Fund | 78,022 |
| Lois G. Greenall Fund | 145,085 |
| Lulu Blanche Hart & Harry Utter Hart Memorial Fund | 778,782 |
| M. Jessie Chagnon Fund | 71,196 |
| Mabel Beatrice Studd Fund | 15,000 |
| Mabel D. Leadlay Fund | 75,891 |
| Margaret & William Gilmour Fund | 8,380 |
| Margaret Anne Hayward Fund | 797,598 |
| Margaret E. Tschetter Fund | 383,739 |
| Marjorie L. Allan Fund | 5,000 |
| Marjorie Wild Fund | 30,724 |
| Marnie & Bill Brehm Family Fund | 43,000 |
| Marnie Spears Fund | 22,195 |
| Martha McKinnell Serrels Fund | 94,682 |
| Mary & Earl Brooks Fund | 1,354,969 |
| Mary E. Hatch Fund | 116,000 |
| Mildred E. Hunter Fund | 100,878 |
| Mount Hamilton United Church Legacy Fund | 20,000 |
| Noreen & Seymour Wigle Fund | 15,000 |
| Patricia Eileen Smith Fund | 5,150 |
| Peter & Rose Marie Palmer Fund | 10,848 |
| Petra Cooke Memorial Fund | 32,400 |
| Project Sunday Fund | 8,771 |
| Ralph E. Ingraham Fund | 16,017 |
| Ralph W. & Evelyn J. Cooper Fund | 151,000 |
| Renate & Bob Davidson Fund | 11,000 |
| Reynolds Family Fund | 141,839 |
| Robert C. & L. Ann Glass Fund | 100,000 |
| Robert D. Crockford Fund | 14,075 |
| Robert George Sparre Fund | 34,410 |
| Robert J. & Joan Harrison Fund | 10,266 |
| Robert P. McBride Fund | 1,636,012 |
| Royal Hamilton College of Music Faculty Fund | 5,963 |
| Russell & Mae Lindley Fund | 10,400 |
| Ruth G. & Fred J. Spencer Fund | 23,000 |
| The Samuel & Dora McFarlane Fund | 14,000 |
| Samuel Ringer Fund | 70,586 |
| Sandra & John Black Fund | 195,609 |
| Sarah Smith Fund | 230,729 |
| The Spectator Fund | 10,000 |
| Stait Family Fund† | |
| Stewart Philp Fund | 45,000 |
| Tim and Dale Langs Fund | 189,409 |
| Tod Laing Fund | 7,950 |
| Vangie M. Crosthwaite Fund | 41,292 |
| Vera M. Elwin Fund | 536,235 |
| Vincenza Travale Fund | 22,200 |
| W. Jones Fund | 25,920 |
| West-Moynes Fund | 8,500 |
| Wheeler Family Fund | 11,100 |
| William F. Brand Fund | 8,404 |
| William Gordon Kitchener Fund | 60,000 |
| William S. Sparham Fund | 25,236 |
| Flowthrough funds |
|---|
| #HamOntForever Fund |
| Ambery Fund |
| ArcelorMittal Dofasco Children and Youth Fund |
| Creative Arts Fund |
| Ellen Creaghan Fund |
| Fengate Recreation Fund |
| Green Shield Canada Community Granting Fund |
| Hamilton Prosperity Fund |
| Hamilton Spectator Summer Camp Fund |
| Maple Leaf Centre for Action on Food Security Fund |
| Marlies & Alan Clark Fund |
| Payne Fund |
| School Nourishment Fund |
| True Sport Fund |
| Community Fund: Unrestricted fund A-I | |
|---|---|
| #HamOnt Forever Fund | 5,000 |
| A. May Davis Fund | 41,598 |
| A.H. Tallman Bronze Co. Ltd. Fund | 21,790 |
| Alfred Charles & Pearl Gertrude Swanwick Fund | 200,000 |
| Alice Redman Gooch Fund | 25,025 |
| Alice Vera Morgan Fund | 338,065 |
| Alphonse Dirse Fund | 48,344 |
| Anne M. Biggar Fund | 460,327 |
| Annie S. Nieman Fund | 36,081 |
| Averil Gray & Florence Gray Fund | 1,172,308 |
| Bertha Savage Fund | 47,806 |
| Bill and Jane Evans Family Fund† | |
| Brenda & Reg McGuire Fund | 5,150 |
| Brenda Morris Fund | 5,000 |
| Cameron K. MacGillivray Fund | 9,325 |
| Caroline May Alvey Fund | 118,000 |
| Catherine C.H. Murray Fund | 50,050 |
| Charles & Catherine Ralph Fund | 43,131 |
| Charlotte Cauley Fund | 34,987 |
| Christina Cooper Fund | 173,405 |
| Christina I. Hammant Fund | 250,000 |
| Clare B. Hunter Fund | 13,079 |
| D. Argue Martin Fund | 20,340 |
| Dan and Helen Geagan Fund | 31,096 |
| Daniel T. Lawrie Fund | 115,529 |
| Diffey Family Fund† | |
| Donald A. Cooper Fund | 40,126 |
| Donald & Alice Cannon Fund | 17,005 |
| Donald H. Henderson Fund | 408,597 |
| Donald J. Allan Fund | 103,514 |
| Doreen & Gordon Birk Fund | 98,409 |
| Doris M. Allen Fund | 172,918 |
| Dorothy & Travice Broadbent Fund | 7,000 |
| Dorothy Cauley Fund | 78,831 |
| Dorothy I. Linfoot Fund | 20,588 |
| Dr. Alexander A. Numbers Fund | 5,844 |
| Dr. Carl Martin Memorial Fund | 5,000 |
| Dr. Ronald P. Graham Fund | 16,814 |
| E. Francis Dennee Fund | 24,322 |
| Edna E.R. Reeves Fund | 78,766 |
| Edna Fern Flewelling Fund | 29,761 |
| Edna Robertson Memorial Fund | 29,000 |
| Eleanor Foster Fund | 869,072 |
| Eleanor Jean Milton Fund | 63,610 |
| Eleanor M. Smith Fund | 10,000 |
| Elizabeth Lee Fund | 11,775 |
| Elizabeth Mary Hamilton Fund | 30,000 |
| Elsie M. Husband Fund | 12,300 |
| Erie Hossack Fund | 58,638 |
| Erma Z.L. Goering Fund | 888,437 |
| Ernest & Ruth Brunton Fund | 29,000 |
| Ethel H. Prouse Fund | 181,684 |
| Eulalia D. Wall Fund | 170,977 |
| Evelyn & Richard Geraghty Storms Memorial Fund | 25,000 |
| Evelyn Patricia Lyons Fund | 5,000 |
| Fell Family Fund | 40,065 |
| Flora L. McNeil Fund | 30,165 |
| Florabel Condy Fund | 25,000 |
| Frances W. Ambrose Fund | 5,600 |
| Francis Spence Hutton Fund | 32,650 |
| Frederick J. Mills Fund | 26,189 |
| Gallagher Family Fund | 82,700 |
| George Earle Drewett and Arline Myra Drewett Memorial Fund | 69,852 |
| Gilbert P.V. Belton Fund | 175,088 |
| Gladys A. Whittaker Fund | 26,205 |
| Gordon & Ethel Holmes Fund | 97,572 |
| Grace J. Smith Fund | 13,030 |
| Hanna & Joseph Dubeck Fund | 5,000 |
| Harold E. Clarke Fund | 86,120 |
| Harvey and Audrey Smith Fund | 544,860 |
| Helen Gertrude Harrison Fund | 34,222 |
| Helen Mary Archambeault Fund | 25,316 |
| Henrietta F. Campbell Fund | 104,959 |
| Herbert P. and I. Flora Frid Fund | 354,466 |
| Horace A. Bennett Fund | 10,000 |
| Howard & Edna Tugman Memorial Fund | 100,000 |
| Ian & Donna Cowan Fund | 5,750 |
| Irene Caldwell Memorial Fund | 10,000 |
| Community Fund: Arts endowment fund | |
|---|---|
| Callie Archer Fund† | |
| Gail Robinson-Gow Fund | 68,245 |
| Linda Towart Arts Endowment Fund | 10,000 |
| Accumulated donations under $5,000 | 762 |
| Community Fund: Environment endowment fund | |
|---|---|
| Bob and Peggy Savage Fund | 15,000 |
| Irene Emilie Lowes Estate | 21,493 |
| Robert D. Crockford Fund | 33,120 |
| US Steel Canada Environment Endowment Fund | 600,000 |
| The Young Fund | 15,145 |
| Accumulated donations under $5,000 | 10,346 |